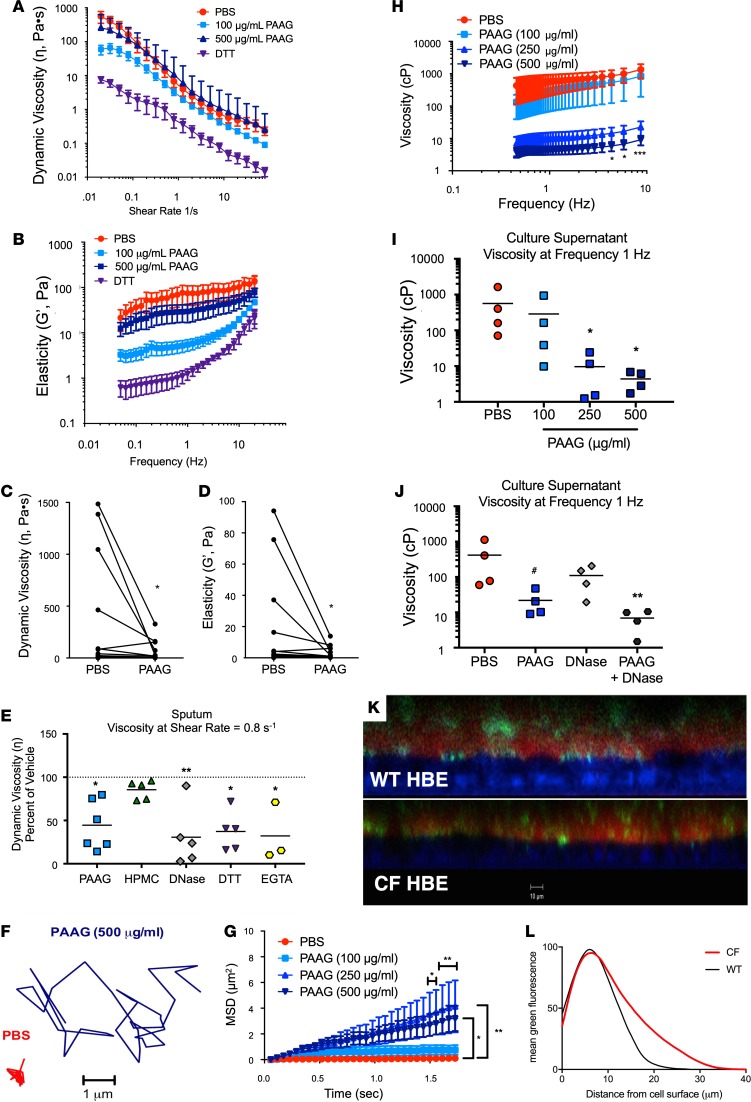
Figure 1. Effect of PAAG on the viscoelastic properties of expectorated CF sputum and mucus from cultured epithelial cells.
(A–E) Sputum collected from CF subjects was treated with PBS, PAAG, HPMC, DNase, or DTT as a positive control. (A) Dynamic viscosity (η) curves show decreased viscosity with PAAG at low (i.e., physiologic) frequency as compared with PBS. (B) Shear-dependent elastic modulus (G′) shows an effect of 100 μg/ml PAAG across all frequencies reduction in sputum elasticity compared with control. (C) Summary data of dynamic viscosity (η) at a frequency sweep of 0.8 Hz (low but reliable frequency, as expected to occur in vivo) shows a significant decrease in viscosity with 100 μg/ml PAAG treatment. Each line represents a sputum sample; some donors were evaluated more than once on separate clinical encounters (n = 13). (D) Similar analysis of sputum elastic modulus (G′). *P < 0.05 by Wilcoxon’s rank test. (E) Summary data of dynamic viscosity (η) at a frequency sweep at 0.8 Hz comparing the effect of PAAG with the addition of the neutral polymer control HPMC, the known mucolytic DNase, and the Ca2+ chelator EGTA. Replicates derived from n = 6 sputum samples and divided among conditions; *P < 0.05, **P < 0.01 by Kruskal-Wallis test with Dunn’s MCT. (F) Representative particle track of 500 nm PEG-coated nanoparticle placed in mucus layer of Phe508del/Phe508del HBE cells treated with PAAG (10 μl of 2, 5, and 10 mg/ml PAAG added apically, to achieve 100, 250, and 500 μg/ml final concentrations, respectively, in the ASL) versus PBS control 24 hours prior to assay. (G) Summary data plotting mean squared displacement (MSD) versus time. Increased slope is an indicator of increased diffusion and decreased mucus viscosity. Doses shown are estimated ASL concentrations, as described above. (H) Particle tracking microrheology (PTM) analysis of data in G (250 and 500 μg/ml) showed a marked decrease in viscosity as compared with vehicle control. Reduced viscosity was seen across all ranges of a frequency sweep (0.46–17.36 Hz), indicating that the effect was robust. Viscosity of normal HBE cells at 1.0 Hz is 17.7 ± 4.3 cP (23). (I) Summary data of frequency sweep at 1 Hz. (J) Summary data at frequency sweep 1 Hz with PAAG compared with the mucolytic DNase. n = 4 filters/condition. *P < 0.05, **P < 0.01, ***P < 0.001, #P = 0.11 by 2-way ANOVA with Tukey’s (G and H) or by Kruskal-Wallis test with Dunn’s MCT (I and J). (K and I) Fluorescence image of WT HBE and CF HBE monolayer treated with 250 μg/ml of PAAG-FITC shows that PAAG intermingles within the mucus layer (K) and is predominantly localized within close proximity to the epithelial surface (L). ASL dyed with Texas red to provide contrast. Scale bar: 10 μm; n = 4 filters/condition.

