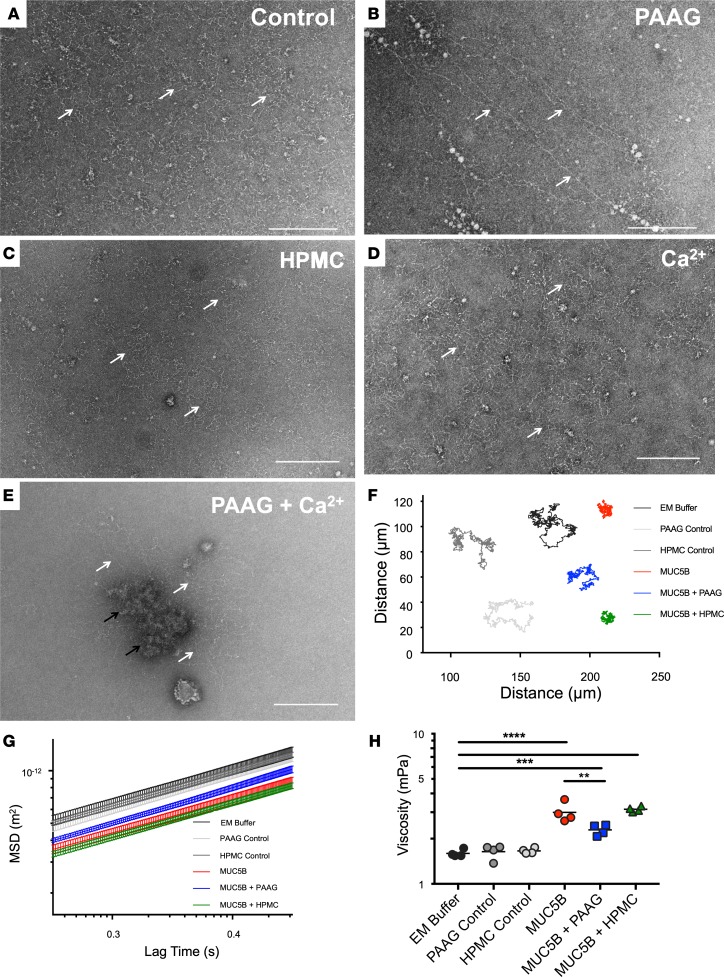
Figure 3. The MUC5B network is structurally altered in the presence of PAAG.
Effects of PAAG on purified MUC5B were analyzed using TEM and PTM; scale bars: 200 nm. (A–E) MUC5B at a concentration 50 μg/ml was visualized untreated and in the presence of 100 μg/ml PAAG, 100 μg/ml HPMC, 10 μg/ml Ca2+ individually or in combination. Black and white arrows highlight the position of MUC5B polymers. A linearization of mucin is observed in the presence of PAAG, while HPMC treatment results in no such conformational change. Representative images are shown. (F–H) MSDs of 505-nm polystyrene beads (in 0.1 M NaCl, 10 mM Tris-HCl solutions with 150 μg/ml MUC5B, 100 μg/ml PAAG, 100 μg/ml HPMC or in combination) were derived from 15 videos per sample, and repeated on 4 separate occasions. Representative tracks are shown in F. MSD values (G) were then used to derive the viscosity of each sample (H). n = 4/condition; **P < 0.01, ***P < 0.01, ****P < 0.0001 by 1-way ANOVA with Tukey’s.

