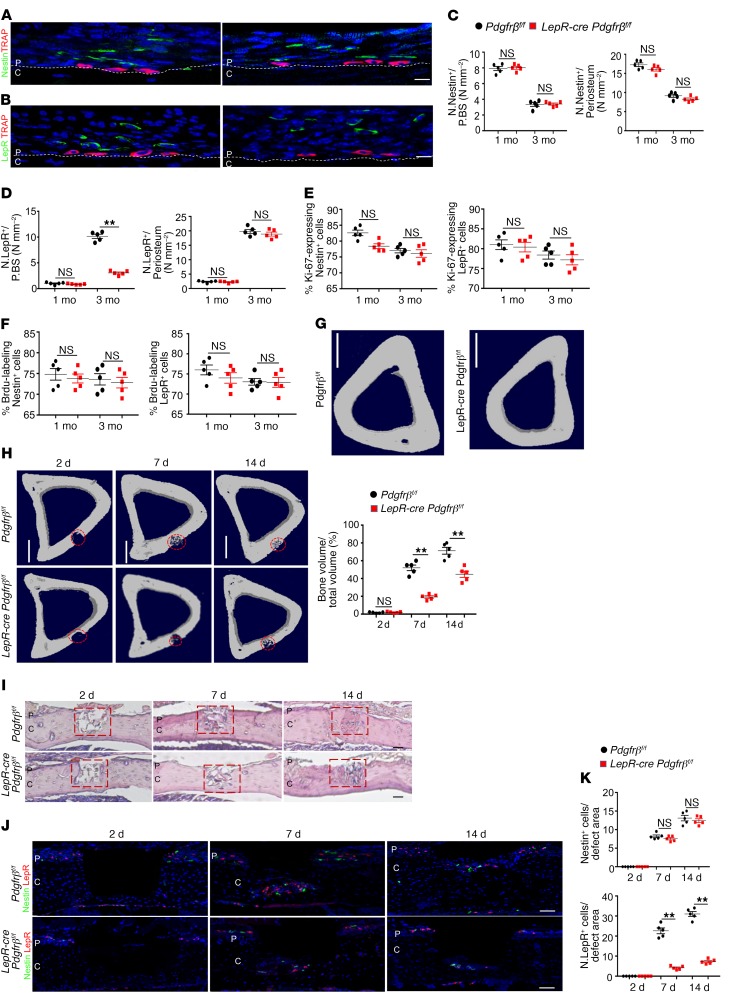
Figure 8. Knockout of Pdgfr-β in LepR+ cells impairs recruitment of PDCs and periosteal bone formation in adult mice.
(A and B) Representative images of coronal tibia diaphyseal periosteum sections from LepR-cre Pdgfr-βfl/fl mice and Pdgfr-βfl/fl mice stained for TRAP and Nestin (A) and TRAP and LepR (B). (C and D) Quantification of Nestin+ cells (C) and LepR+ cells (D) in the inner layer of periosteum (no. cells/P.BS) and/or whole periosteum (no. cells/periosteum). Scale bars: 20 μm (n = 5 mice/group). (E and F) Percentage of Ki-67+ (E) or Brdu+ (F) cells in Nestin+ or LepR+ cells on periosteum (n = 5 mice/group). (G) Representative μCT images. Scale bars: 1 mm (n = 5 mice/group). 1 M, 1-month-old; 3 M, 3-month-old. (H) Tibiae 14 days after cortical bone defect surgery. Representative μCT images of tibial cortex and quantification of newly formed bone volume (BV/TV). Scale bars: 1 mm (n = 5 mice/group). (I) H&E staining of defect site sections. Red boxes indicate the defect sites. Scale bars: 200 μm (n = 5 mice/group). (J and K) Representative images of defect site sections stained for Nestin and LepR. Quantification of Nestin+ cells (K, left panel) and LepR+ cells (K, right panel) in the defect sites. Scale bars: 100 μm (n = 5 mice/group). Dashed lines indicate the limit between periosteum and cortical bone. Data are presented as mean ± SEM. *P < 0.05; **P < 0.01. C, cortical bone; P, periosteum; NS, not significant as determined by 2-tailed Student t test.

