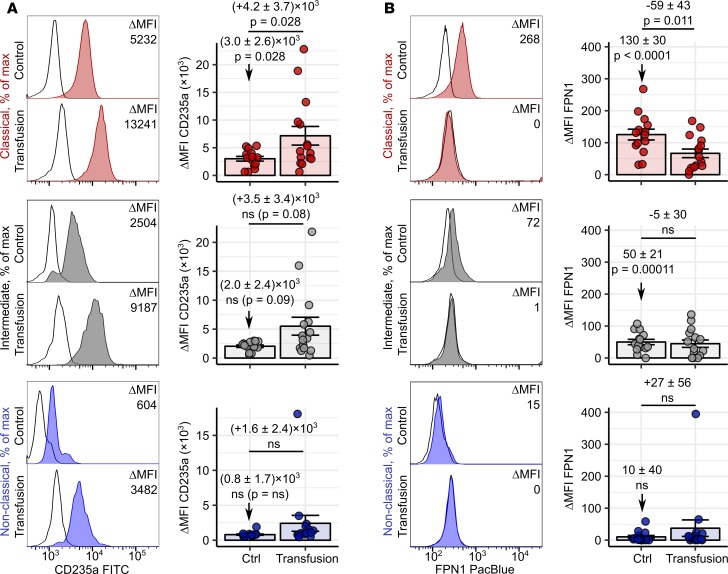
Figure 13. Erythrophagocytosis by blood monocytes in homeostasis and under hematological stress.
PBMCs were obtained from healthy individuals (n = 16) and patients who had received blood transfusions within the past 24 hours (n = 15). Intracellular CD235a levels (A) and surface FPN1 expression (B) in each monocyte subpopulation were determined by flow cytometry. Monocyte subpopulations were defined as described in Supplemental Figure 14AB (red: classical; gray: intermediate; blue: nonclassical monocytes). Representative CD235a and FPN1 histograms are shown (tinted histograms: specific antibody staining; open histograms: isotype). Graphs show ΔMFI values. Each point represents 1 measurement, bars denote mean, and error bars represent SEM. Statistical significance for basal CD235a and FPN1 levels in controls and the control-transfused differences were determined with first-order linear models. Separate models were applied to each monocyte subset. Estimate values with 95% CI are shown. Estimate P values were calculated with 2-tailed t test. ANOVA statistics are presented in Supplemental Table 8.

