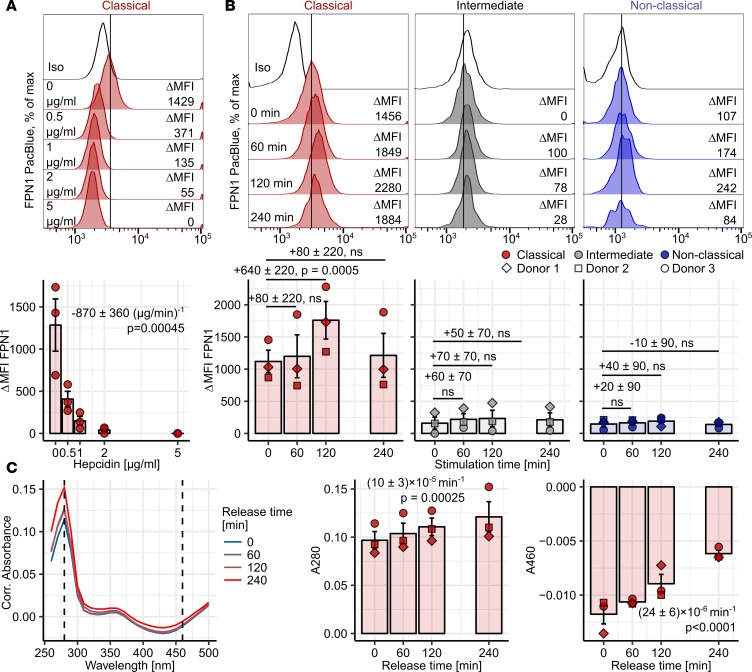
Figure 4. Regulation of classical monocyte FPN1 by hepcidin and iron and its functionality.
(A and B) PBMCs (n = 3 healthy donors) were incubated with the indicated hepcidin concentrations (A) or 10 μM Fe3+ [B, Fe2(SO4)3]. Surface FPN1 levels in monocyte subsets were determined by flow cytometry. Monocyte subpopulations were defined as described in Supplemental Figure 2A (red: classical; gray: intermediate; blue: nonclassical monocytes). Representative signal histograms are shown (open histograms: isotype; tinted histograms: FPN1). Graphs display ΔMFI values; each point represents 1 measurement, bars denote mean, and error bars represent SEM. The cell donor is represented by symbol shape. Statistical significance was assessed with second-order (A) and first-order linear models (B); a separate model was applied to each monocyte subset. Estimates for the first-order hepcidin term (A) and for changes in FPN1 ΔMFI at particular time points (B) are shown with 95% CI. Estimate P values were calculated with 2-tailed t test. ANOVA for the first-order hepcidin term: P = 0.00023 (F1,12 = 27). ANOVA for the iron terms (B): classical monocytes: P = 0.00039 (F3,9 = 18); intermediate monocytes: P = 0.045 (F3,9 = 4); nonclassical monocytes: P = NS (F3,9 = 0.64). (C) 10 μM Fe3+-loaded CD14+ monocytes (n = 3 healthy donors) were incubated with 0.5 mg/ml apo-TF for the indicated time points. Apo-TF: holo-TF conversion in culture supernatant was monitored by absorbance measurements at 280 (A280) and 460 nm (A460). Culture medium without apo-TF served as a blank sample. Representative absorbance spectra are shown. Graphs depict absorbance values. Each point represents 1 measurement, bars denote mean, and error bars represent SEM. The cell donor is represented by symbol shape. Statistical significance was assessed with second-term linear models. Estimates for absorbance change rate are shown with 95% CI. Estimate P values were calculated with 2-tailed t test. ANOVA for the rate term: A280: P = 0.00013 (F1,9 = 40); A460: P < 0.0001 (F1,9 = 63).

