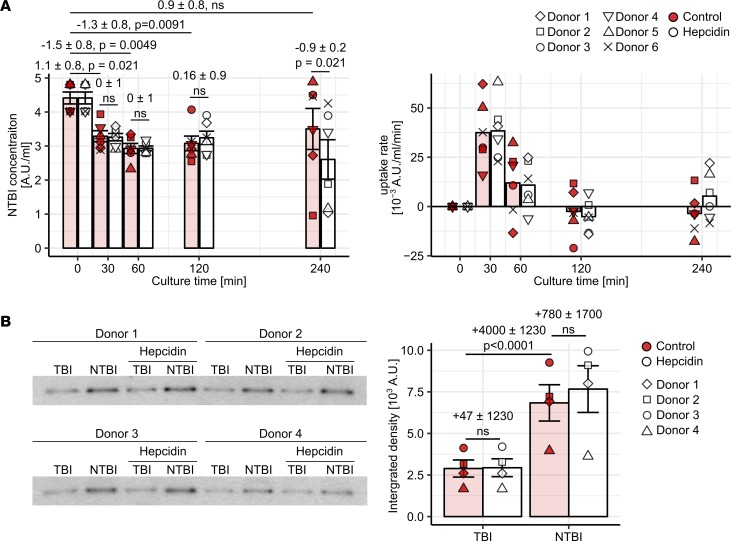
Figure 6. Hepcidin-enhanced NTBI clearance by classical and intermediate monocytes.
(A) CD14+ monocytes (n = 6 healthy donors) were cultured with 10 μM Fe3+ [Fe2(SO4)3] with/without 2 μg/ml hepcidin. NTBI concentration in supernatant and NTBI uptake rate at the indicated time points were determined. On the graphs, each point represents 1 measurement, bars denote mean, and error bars represent SEM. The cell donor is represented by symbol shape. Statistical significance was assessed with a first-order linear model. Estimates for the baseline NTBI concentration, changes in concentration at the particular time points, and for differences in concentration between control and hepcidin-stimulated samples are shown with 95% CI. Estimate P values were calculated with 2-tailed t test. ANOVA for the time and time-hepcidin interaction terms: Ptime = 0.00057 (F5,30 = 6.7), Ptime-hepcidin = NS (0.13) (F5,30 = 1.9). (B) CD14+ monocytes (n = 4 healthy donors) were stimulated with 0.5 μM 59Fe3+ (TBI) or 0.5 μM 59Fe3+ and 10 μM 56Fe3+ (NTBI) with/without 2 μg/ml hepcidin for 4 hours. 59Fe-ferritin in cell lysates was visualized by autoradiography. Autoradiograms and densitometry results are shown (colored symbols: control, open symbols: hepcidin). On the graphs, each point represents 1 measurement, bars denote mean, and error bars represent SEM. The cell donor is represented by symbol shape. Statistical significance was estimated with a first-order linear model. Estimates for changes in 59Fe-ferritin levels between culture conditions are shown with 95% CI. Estimate P values were calculated with 2-tailed t test. ANOVA for the NTBI, hepcidin, and NTBI-hepcidin interaction terms: PNTBI < 0.0001 (F1,12 = 113), Phepcidin = NS (F1,12 = 1.2), PNTBI: hepcidin = NS (F1,12 = 0.92).

