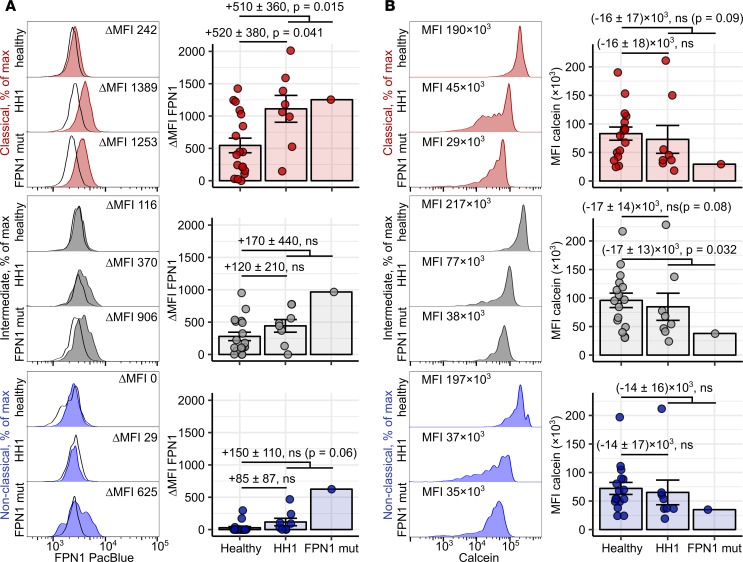
Figure 9. Accumulation of labile iron and regulation of FPN1 in blood monocytes in iron overload diseases.
(A and B) Blood samples (FPN: whole-blood leukocytes, calcein: PBMCs) were obtained from healthy controls (n = 18), type 1 hemochromatosis patients (HH1, n = 8), and a FPN1 loss-of-function heterozygous individual (FPN1 mut, n = 1). Surface FPN1 expression (A) and calcein fluorescence (B) in monocyte subpopulations were determined by flow cytometry. Monocyte subpopulations were defined as described in Supplemental Figure 10AB (red: classical; gray: intermediate; blue: nonclassical monocytes). Calcein MFI is assumed to be inversely proportional to LIP levels. Representative signal FPN1 and calcein histograms are shown (tinted histograms: specific staining, open histograms: isotype). Graphs show ΔMFI and MFI values. Each point represents 1 measurement, bars denote mean, and error bars represent SEM. Statistical significance for the healthy vs. HH1 and healthy vs. iron overload (HH1 and FPN1 mutant) comparisons were determined with first-order linear models. Separate models were applied to each monocyte subset. Estimate values with 95% CI and P values are shown. Estimate P values were calculated with 2-tailed t test. ANOVA statistics are presented in Supplemental Table 6.

