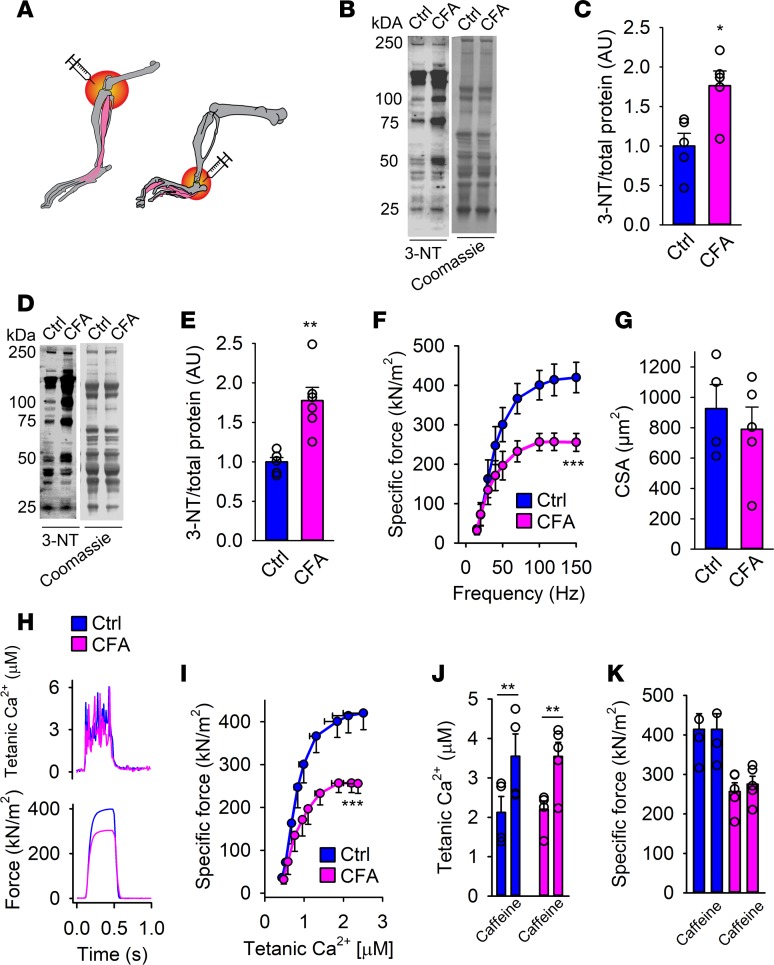
Figure 1. Muscle weakness and accompanied oxidative modifications in skeletal muscle from mice with arthritis.
(A) An illustration of the induction site of arthritis by complete Freund’s adjuvant (CFA) (ankle: used for flexor digitorum brevis [FDB] muscle fiber force measurements; knee: used for extensor digitorum longus [EDL] whole-muscle force measurements). Immunoblots and quantification of 3-nitrotyrosine (3-NT) in interosseous (B and C) and gastrocnemius (D and E) muscle from mice with arthritis (CFA) and healthy controls (Ctrl) (n = 6). 3-NT levels were normalized to total protein Coomassie staining. (F) Ex vivo specific force (contractions induced at 15–150 Hz, n = 4–5) of intact individual muscle fibers from arthritis leg (pink) and healthy controls (blue). (G) Calculated cross-sectional area of FDB fibers from CFA and control legs. (H) Typical examples (120-Hz stimulation frequency, 350-ms train duration) of intracellular (tetanic) Ca2+ (upper) and specific force (lower) in control (blue) and CFA (pink) fibers (n = 4–5). (I) Mean (±SEM) force versus intracellular Ca2+ data obtained in 15- to 150-Hz contractions produced in control fibers and CFA fibers. Mean values of intracellular Ca2+ (J) and specific force (K) in the presence or absence of caffeine (5 mM, 2-minute exposure) in CFA and control FDB fibers. Data are mean ± SEM. Statistical analysis in C, E, G, J, and K was performed using 2-tailed Student’s t test and in F and I by 2-way ANOVA. A P value less than 0.05 was considered significant. *P < 0.05; **P < 0.01; ***P < 0.001.

