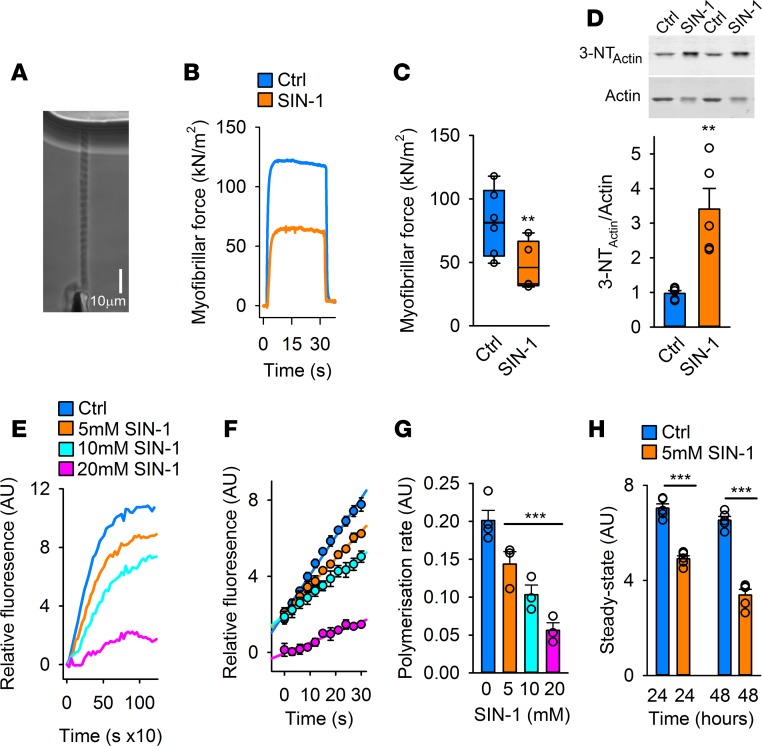
Figure 2. Oxidative modifications introduced by SIN-1 decrease myofibrillar force and impair actin polymerization.
(A) Phase-contrast image of an isolated myofibril set up for force measurement using the atomic force cantilever (AFC). (B) Typical recordings of active force from AFC measurements in myofibrils at pCa2+ of 4.5 with and without SIN-1 (10 mM, 10 minutes) with DTT present (1 mM DTT) (n = 9–10). (C) Mean (±SEM, n = 9–10) of the active isometric force produced by the myofibrils with or without SIN-1 at a sarcomere length of 2.8 μm and pCa2+ 4.5. (D) Immunoblots and quantification of the 3-NT level on myofibrillar actin (n = 9–10). (E) Typical polymerization recordings of the actin polymerization assay using pyrene-labeled actin polymerized with control G-actin (Ctrl) or G-actin preincubated in SIN-1 (5, 10, or 20 mM; 15-minute preincubation time) (n = 3–4). (F) Mean fluorescence intensity (±SEM, n = 3–4) of the polymerization reaction at half maximum level of polymerization of Ctrl and SIN-1 G-actin (5, 10, or 20 mM, 15 minutes). (G) Mean (±SEM, n = 3–4) polymerization rate during linear elongation stage of polymerization of Ctrl and SIN-1 G-actin (5, 10, or 20 mM, 15 minutes). (H) Mean fluorescence (±SEM, n = 3–4) of Ctrl and SIN-1 (5 mM) G-actin at steady state of G-actin polymerization, 24 and 48 hours after induction of the polymerization. Statistical analysis for C, D, and H was performed by applying 2-tailed Student’s t test. For G, 1-way ANOVA with Holm–Sidak post hoc test was used. A P value less than 0.05 was considered significant. **P < 0.01; ***P < 0.001.

