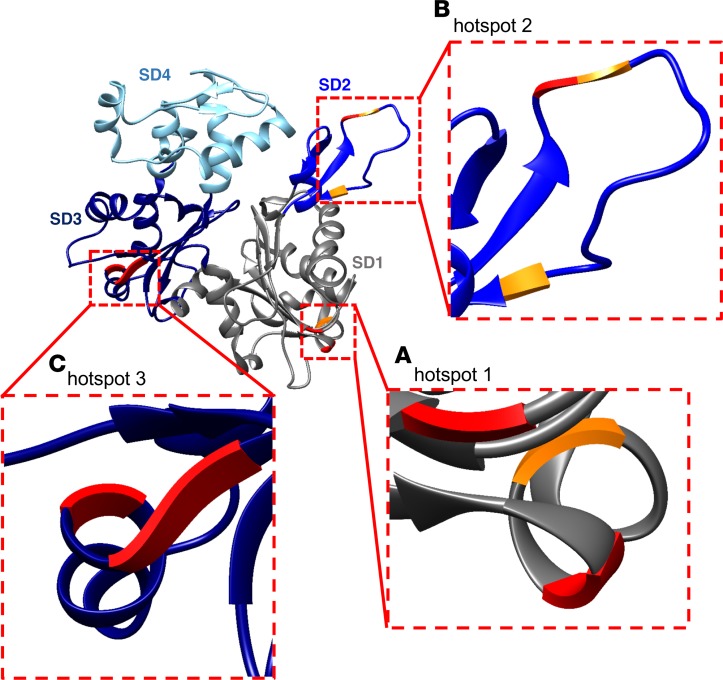
Figure 4. Three oxidative hotspots on the actin monomer.
The actin monomer with the 3 oxidative hotspots identified by mass spectrometry, visualized with zooms. (A) Hotspot 1 in subdomain 1 (SD1) with histidine (H) 101/MDA, glutamine (Q) 360/MDA, and tyrosine (Y) 362/3-NT. (B) Hotspot 2 in SD2 with H40/MDA, Q41/MDA, and Y53/3-NT. (C) Hotspot 3 in SD3 with Y294/3-NT, asparagine (N) 296/MDA, and N297/3-NT. Amino acids in red represent those residues that had the same modification in SIN-1–treated actin and actin from CFA mice (6 out of 9). The models were generated with UCSF Chimera (82).

