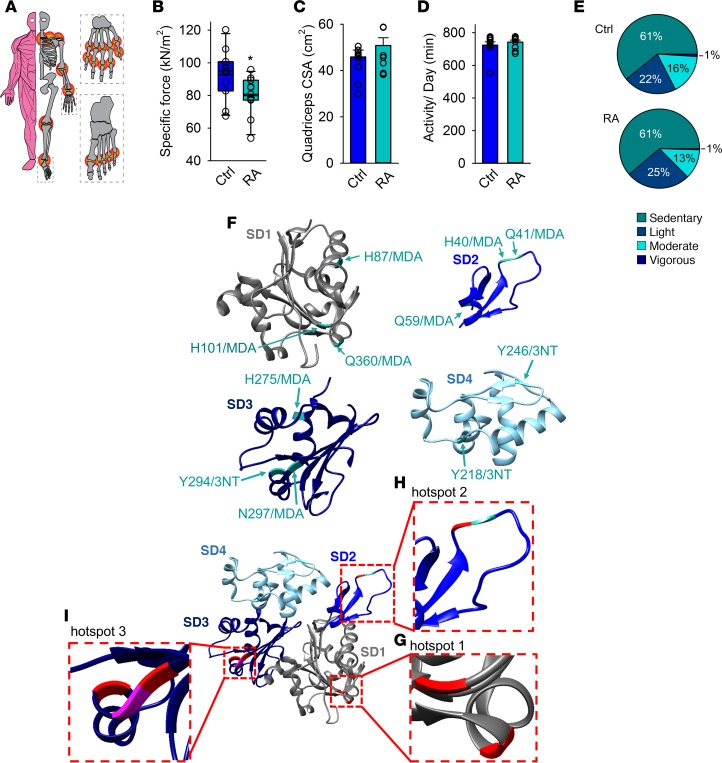
Figure 5. Patients with RA exhibit muscle weakness and matching oxidative hotspots on the actin monomer.
(A) An illustration of the composite disease activity score (DAS), with a 44-joint count (red circles) to assess swelling and 53-joint count to assess pain (DAS can range from 0.23 to 9.87). Mean ± SEM DAS was 3.3 ± 0.4 (n = 11, see Supplemental Table 3 for details). (B) Mean ± SEM of isometric specific force of quadriceps femoris from patients with RA and healthy controls (n = 11 per group). (C) Cross-sectional area (CSA) of quadriceps femoris measured by CT scans (mean ± SEM, n = 11). (D) Total daily activity in minutes measured with Actilife accelerometers (mean ± SEM, n = 11) and (E) percentage time spent in each defined activity category. (F) Overview of the oxidative 3-nitrotyrosine (3-NT) and malondialdehyde (MDA) modified amino acids on skeletal muscle actin (SD1–SD4) identified by mass spectrometry in patients with RA (n = 5). The actin model is adapted from the 2ZWH crystal structure of the Protein Data Bank Europe (PDBe). Tyrosine residues (Y) were nitrated (3-NT), whereas histidine (H), glutamine (Q) and asparagine (N) were MDA modified. (G–I) The actin monomer model illustrating that the oxidative hotspots in patients with RA (green) coincide with hotspots in mice with arthritis (pink). Amino acids depicted in red ribbons represent the residues that had the identical modification on actin in RA patients and CFA mice (5 out of 11). Generated with UCSF Chimera (82). Statistical analysis was performed using 2-tailed Student’s t test. A P value less than 0.05 was considered significant. *P < 0.05.

