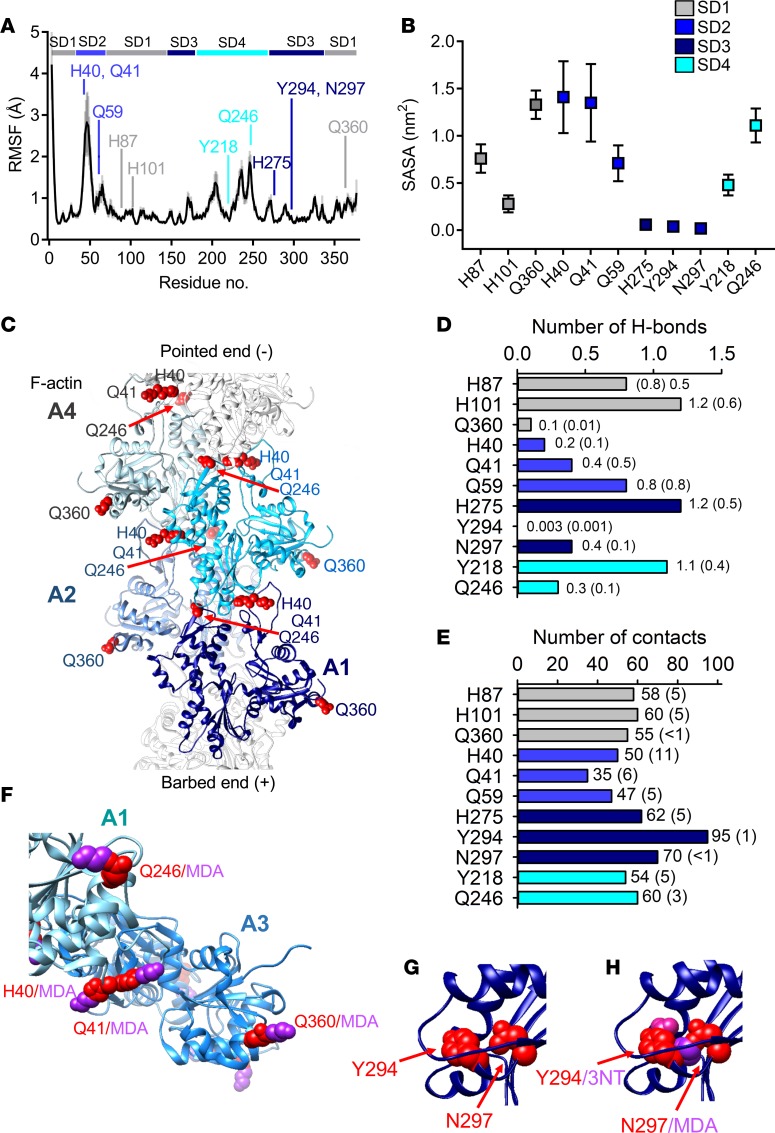
Figure 6. Altered filament stability, intersubdomain interactions, and myosin interaction with oxidative modifications on actin.
Analysis of molecular dynamics (MD) simulations calculated from trajectories of four 100-ns MD simulations of ATP-bound F-actin. (A) Root mean square fluctuation (RMSF) values of the Cα atoms (black line with gray shadow showing the standard deviation). RMSF values are averages of 2-ns blocks, calculated for the last 60 ns of the simulation time for the four 100-ns simulations. Residues exposed to modifications are pointed out in the sequence by their respective amino acid abbreviation and color coded according to its domain. (B) Solvent-accessible surface area (SASA), with SD shown as error bars. (C) F-actin (PDBe: 5MVA) with 4 G-actin monomers (A1–A4) envisioned in light to dark shade of blue. Histidine (H) 40, glutamine (Q) 41, Q246, and Q360 in red spheres showing their intricate location for inter- and intramolecular bonding. (D) Number of H-bonds and (E) contacts between oxidized hotspot residues and the rest of the actin protein. A contact was defined as when the distance was less than 4 Å between 2 non-hydrogen atoms. Values are averages with error estimates from block averaging in parentheses. (F) A model of a fragment of F-actin (A1–A3) (PDBe: 5H53) with malondialdehyde (MDA) added to the residues. (G and H) Hotspot 2 with and without the presence of modifications on tyrosine (Y) 294 and asparagine (N) 297.

