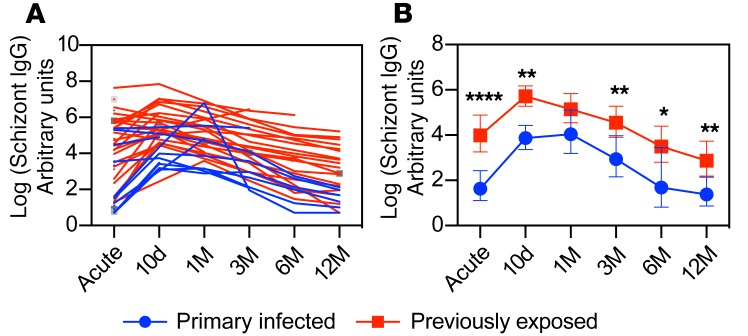
Figure 2. P. falciparum schizont IgG antibody dynamics.
(A) Relative schizont IgG titers for each individual donor. (B) Geometric mean relative antibody titers ± 95% CI grouped as individuals with a primary infection (blue circles, n = 17) or with previous exposure (red boxes, n = 33). All antibody titers are log transformed. Differences between the groups were evaluated by a linear mixed-effects model with restricted maximum likelihood followed by an LS means Student’s t test for specific comparisons. *P < 0.05, **P < 0.01, ****P < 0.0001.

