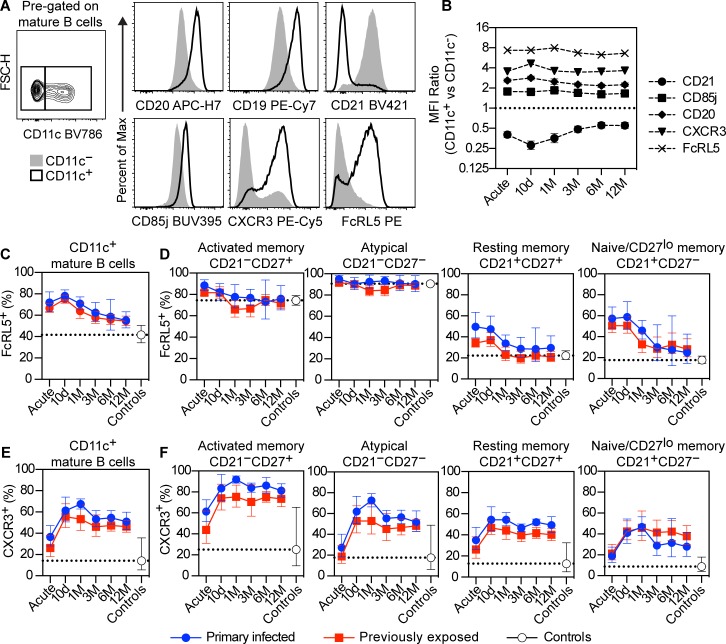
Figure 7. Dynamic expression of FcRL5 and CXCR3 among CD11c+ B cell subsets.
(A) Representative graph showing gating of CD11c+ and CD11c– mature B cells (CD19+CD20+CD10−) from 1 previously exposed donor at 10 days after acute infection (left). Representative expression levels of CD20, CD19, CD21, CD85j, CXCR3, and FcRL5 between CD11c− (filled histograms) and CD11c+ (open histograms) populations from the same donor. (B) MFI ratio between CD11c+ and CD11c– mature B cells for CD21 (circles), CD85j (boxes), CD20 (diamonds), CXCR3 (triangles), and FcRL5 (crosses) at each sample time point. Data represent both primary infected and previously exposed individuals (n = 49). (C) Frequency of FcRL5+ cells among total CD11c+ mature B cells or (D) further separated based on expression of CD21 and CD27. (E) Frequency of CXCR3+ cells among total CD11c+ mature B cells or (F) further separated based on expression of CD21 and CD27. (C–F) Data show geometric mean with error bars indicating ± 95% CI. Primary infected individuals are indicated by blue circles (n = 16), previously exposed individuals by red boxes (n = 33), and healthy controls by white circles (n = 14). The dotted line indicates the geometric mean of the healthy controls.

