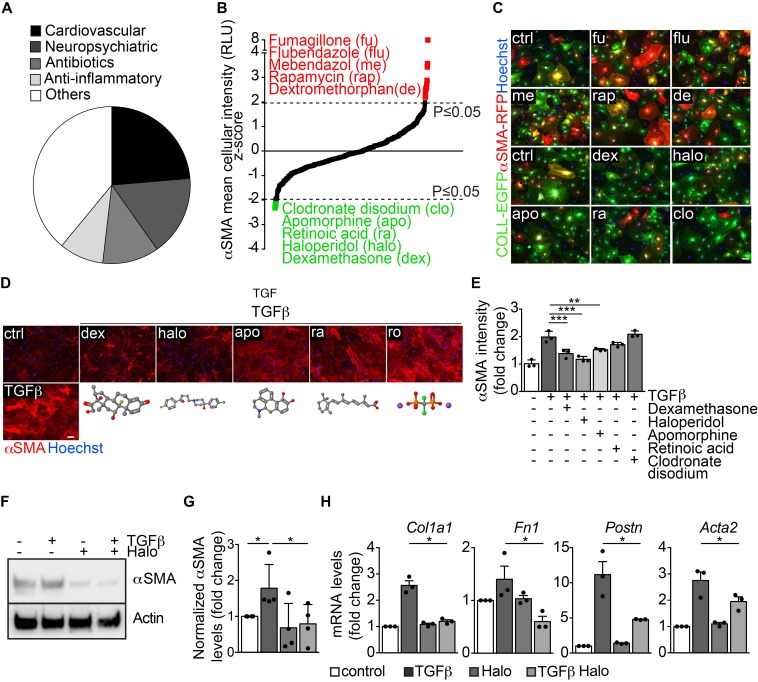
Figure 1. High-throughput screening identifies several modulators of αSMA expression in myofibroblasts.
(A) Pie chart showing the main categories of the 640 FDA-approved drugs included in the library. (B) Results of the high-throughput screening shown as the Z score of the αSMA mean cellular intensity in αSMA-RFP/CoLL-EGFP fibroblasts, treated with each drug at 48 hours of culture. Top hits upregulating αSMA expression are indicated in red, whereas those downregulating αSMA expression are indicated in green. (C) Representative images of αSMA-RFP/COLL-EGFP fibroblasts exposed to the indicated drugs (abbreviations are explained in panel B). Green fluorescence indicates collagen expression (COLL-EGFP), whereas red fluorescence indicates αSMA expression (αSMA-RFP). Nuclei are stained blue with Hoechst. (D) Cardiac fibroblasts treated with TGF-β alone and in combination with various drugs, stained red with anti-αSMA antibodies. Nuclei are stained blue with Hoechst. The chemical structure of each drug is shown under the corresponding cell picture. Atom color assignment: gray, carbon; red, oxygen; green, halogen; blue, nitrogen; orange, phosphorus; purple, sodium. (E) Quantification of the αSMA mean fluorescence intensity upon treatment with TGF-β alone and in combination with the indicated drugs (n = 3/gp). (F) Western blot showing the expression of αSMA in primary cardiac fibroblasts treated with TGF-β, haloperidol (3 μM), or their combination. Actin is shown as loading control. (G) Quantification of αSMA levels in primary cardiac fibroblasts treated with TGF-β, haloperidol (3 μM), and their combination (n = 4/gp). (H) Expression levels of Col1a1, Fn1, Postn, and Acta2 upon treatment with TGF-β, haloperidol, and their combination (n = 3/gp). Values in E, G, and H are mean ± SEM. *P < 0.05, **P < 0.01, ***P < 0.001 by unpaired t test with Welch’s correction. Scale bars in C and D: 50 μm.

