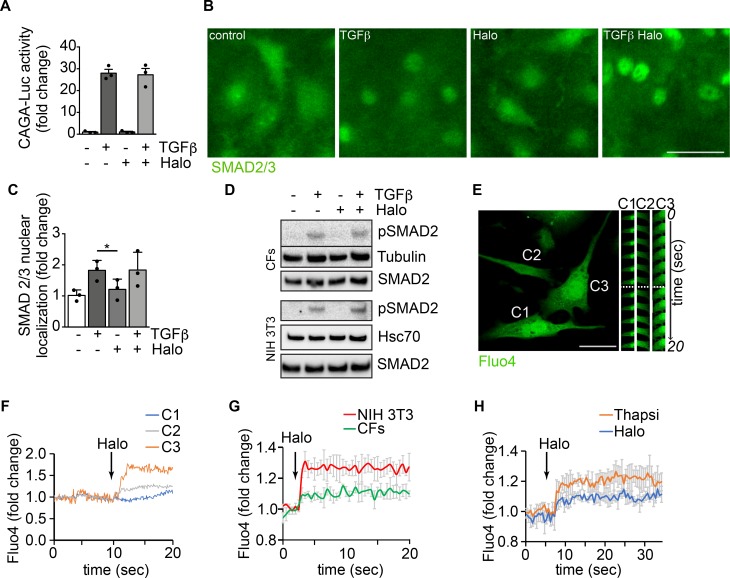
Figure 4. Modulation of αSMA expression by haloperidol involves an increase in intracellular calcium.
(A) Luciferase activity of TGF-β–responsive CAGA-Luc reporter upon treatment with TGF-β, haloperidol, or their combination for 48 hours (n = 3/gp). (B) Representative images of SMAD 2/3 immunofluorescence in primary cardiac fibroblasts treated with TGF-β, haloperidol, or their combination. (C) Quantification of the nuclear/cytosolic localization of SMAD2/3 in cardiac fibroblasts treated with TGF-β, haloperidol, or their combination (n = 3/gp). (D) Western blot showing the expression level of the phosphorylated form of SMAD2 and loading controls (tubulin and Hsc70) upon treatment with TGF-β, haloperidol, or their combination in primary cardiac fibroblasts (CFs) and NIH3T3 cells. Total amount of SMAD2 is shown from a blot run in parallel. (E) Representative images of cardiac fibroblasts loaded with the calcium sensitive dye Fluo4. Time-lapse images of specific regions of interest (ROIs) in 3 different cells (C1, C2, and C3) are shown on the right. The dashed line indicates the time of haloperidol treatment. (F) Quantification of mean fluorescence intensity in each ROI (C1 in blue, C2 in gray, and C3 in orange) upon addition of haloperidol at the time indicated by the arrow. (G) Quantification of Fluo4 fluorescence intensity in NIH3T3 cells (red line) and primary cardiac fibroblasts (CFs, green line) over time. Addition of haloperidol is indicated by the arrow. (H) Quantification of whole-cell Fluo4 fluorescence intensity in primary cardiac fibroblasts treated with either haloperidol (blue line) or thapsigargin (orange line), at the time indicated by the arrow. Scale bars in B and E: 50 μm. Values in A and C are mean ± SEM. *P < 0.05 by unpaired t test.

