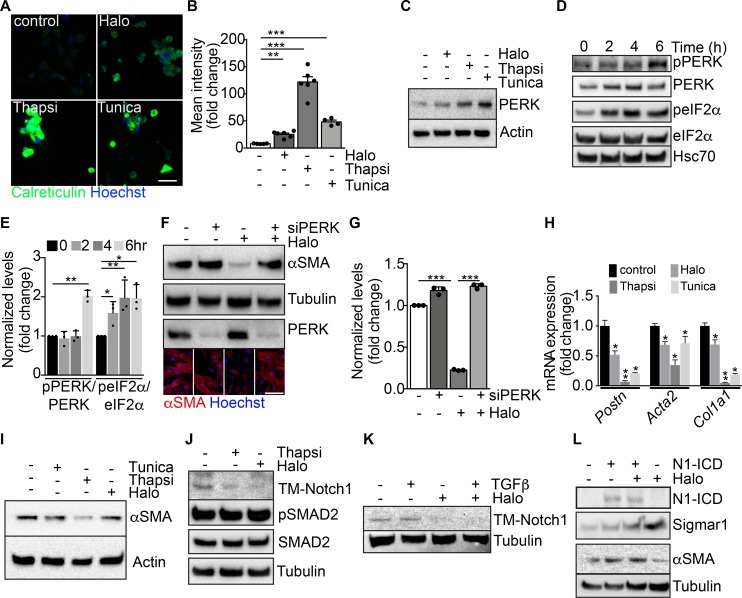
Figure 5. Modulation of ER stress and Notch pathway by haloperidol.
(A) Representative images of cardiac fibroblasts stained for calreticulin (green) and treated with haloperidol (Halo), thapsigargin (Thapsi) and tunicamycin (Tunica). Nuclei are stained blue with Hoechst. (B) Quantification of cytosolic calreticulin (n = 5/gp). (C) Western blot for PERK in cardiac fibroblasts treated with haloperidol, thapsigargin, or tunicamycin for 48 hours. Loading control: actin. (D) Western blot for PERK, eIF2α, and their phosphorylated forms (p-PERK and p-eIF2α) in cardiac fibroblasts at the indicated time points after treatment with haloperidol. Hsc70: additional loading control. The 3 blots were run in parallel. (E) Quantification of p-PERK/PERK and p-eIF2α/eIF2α ratios in cardiac fibroblasts at the indicated time points after treatment with haloperidol (n = 3/gp). (F) Western blot for αSMA and PERK in cardiac fibroblasts treated with haloperidol, siPERK, or their combination. Loading control: tubulin. The 3 blots were run in parallel. Lower panels show representative immunofluorescence for αSMA (red). Nuclei are stained blue with Hoechst. (G) Quantification of αSMA levels in cardiac fibroblasts treated with siPERK, haloperidol, or their combination (n = 3/gp). (H) Levels of mRNA expression of Postn, Acta2, and Col1a1 after treatment with haloperidol, thapsigargin, or tunicamycin (n = 3/gp). (I) Western blot for αSMA upon treatment of cardiac fibroblasts with haloperidol, thapsigargin, or tunicamycin. Loading control: actin. (J) Western blot for the transmembrane form of Notch1 (TM-Notch1), SMAD2 and its phosphorylated form (p-SMAD2) in cardiac fibroblasts treated with either haloperidol or thapsigargin. Loading control: tubulin. The 3 blots were run in parallel. (K) Western blot for TM-Notch1 upon treatment of cardiac fibroblasts with TGF-β, haloperidol, or their combination. Loading control: tubulin. (L) Western blot for the intracellular form of Notch1 (Notch1-ICD), αSMA, and Sigmar1 upon transfection of a constitutively active form of Notch1 (N1ICD) either alone or in combination with haloperidol. Loading control: tubulin. The 3 blots were run in parallel. Scale bars in A and H: 50 μm. Values in B, E, G, and H are mean ± SEM. *P < 0.05, **P < 0.01, ***P < 0.001 by unpaired t test.

