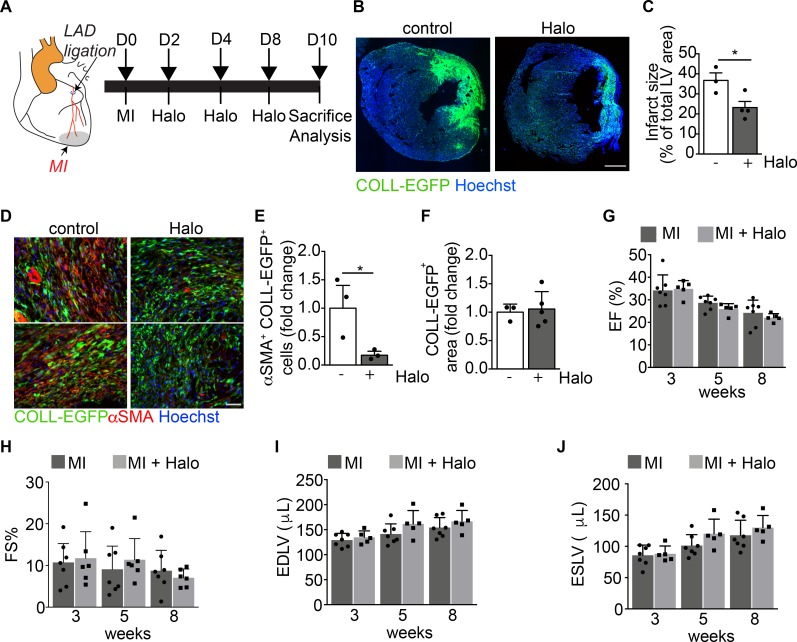
Figure 6. Haloperidol inhibits αSMA expression by cardiac myofibroblasts in vivo.
(A) Schematic of the cardiac fibrosis following myocardial infarction (MI) induced by the ligation of the left descendent anterior coronary artery (LAD). The aorta is indicated in orange, the LAD in red, and the MI in gray. (B) Representative images of the heart sections of COLL-EGFP mice at 10 days after MI, treated with either PBS (control) or haloperidol (Halo). Collagen expression is shown in green (COLL-EGFP) and nuclei are stained blue with Hoechst. (C) Quantification of infarct size in mice treated with either PBS or haloperidol on day 10 after MI (n > 3/gp). (D) Representative images of heart sections of COLL-EGFP mice, following MI and treatment with either PBS or haloperidol, stained red with anti-αSMA antibodies. Nuclei are stained blue with Hoechst. (E) Quantification of the number of αSMA+COLL-EGFP+ fibroblasts in infarcted hearts treated with either PBS or haloperidol (n > 3/gp). (F) Quantification of the COLL-EGFP+ area in infarcted hearts treated with either PBS or haloperidol (n > 3/gp). (G) Quantification of the ejection fraction (EF) in infarcted mice treated with either PBS or haloperidol at 3, 5, and 8 weeks after MI (n > 5/gp). (H) Quantification of the fractional shortening (FS) in mice subjected to MI and treated with either PBS (black bars) or haloperidol (gray bars) at 3, 5, and 8 weeks after MI (n > 5/gp). (I) Quantification of the end-diastolic left ventricular volume (EDLV) in mice subjected to MI and treated with either PBS (black bars) or haloperidol (gray bars) at 3, 5, and 8 weeks after MI (n > 5/gp). (J) Quantification of the end-systolic left ventricular volume (ESLV) in mice subjected to MI and treated with either PBS (black bars) or haloperidol (gray bars) at 3, 5, and 8 weeks after MI (n > 5/gp). Scale bars: 1 mm (B) and 100 μm (D). Values in C and E–J are mean ± SEM. *P < 0.05 by unpaired t test.

