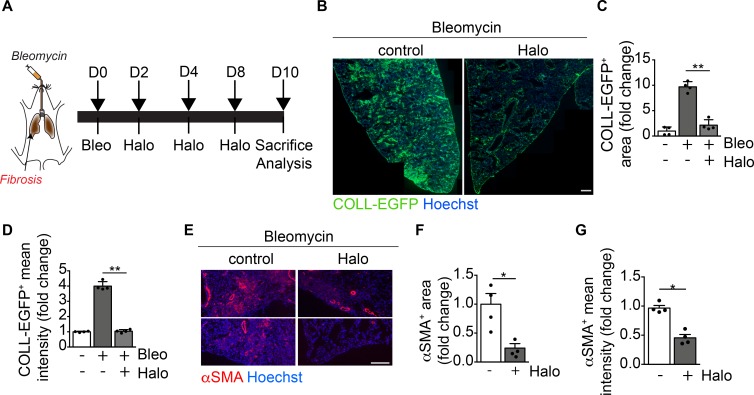
Figure 7. Haloperidol inhibits αSMA expression by lung myofibroblasts in vivo.
(A) Schematic of lung fibrosis induced by intratracheal injection of bleomycin (orange). (B) Representative images of lung sections of COLL-EGFP mice exposed to bleomycin and treated with either PBS (control) or haloperidol. Nuclei are stained blue with Hoechst. (C) Quantification of the COLL-EGFP+ area in lungs exposed to bleomycin upon treatment with either PBS or haloperidol (n = 4/gp). (D) Quantification of the mean cell intensity of COLL-EGFP+ in lung fibroblasts exposed to bleomycin upon treatment with either PBS or haloperidol (n = 4/gp). (E) Representative images of lung sections from mice exposed to bleomycin upon treatment with either PBS (control) or haloperidol, stained red with anti-αSMA antibodies. Nuclei are stained blue with Hoechst. (F) Quantification of αSMA+ area in lungs of mice exposed to bleomycin upon treatment with either PBS or haloperidol (n = 4/gp). (G) Quantification of the mean cell intensity of αSMA+ in lung fibroblasts exposed to bleomycin upon treatment with either PBS or haloperidol (n = 4/gp). Scale bars: 1 mm (B) and 50 μm (E). Values in C, D, F, and G are mean ± SEM.*P < 0.05, **P < 0.01 by unpaired t test.

