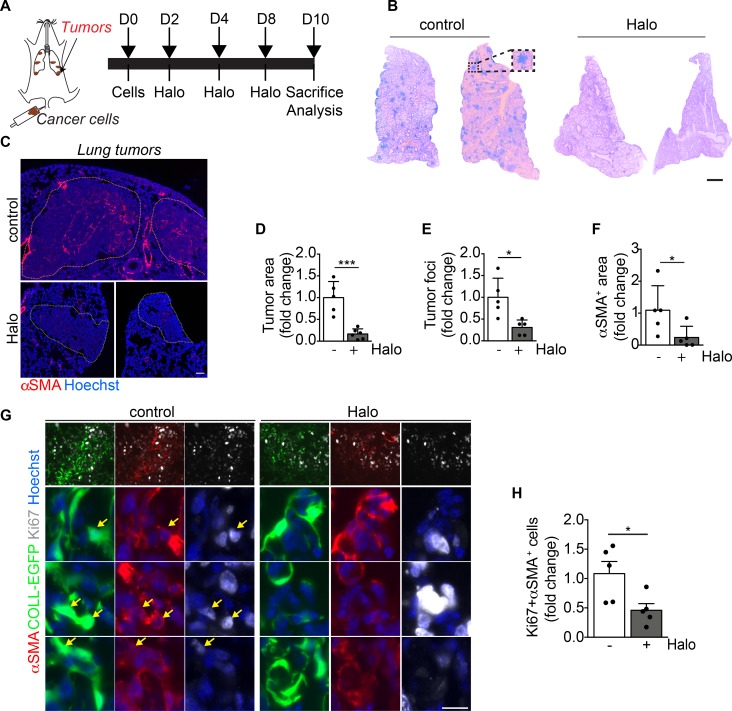
Figure 8. Haloperidol inhibits αSMA expression by cancer-associated myofibroblasts in vivo.
(A) Schematic of orthotopic lung tumors associated with cancer-associated fibroblasts (cancer cells are indicated in brown). (B) Hematoxylin and eosin staining of representative sections of lungs of mice injected with LG cancer cells into the tail vein, upon treatment with either PBS (control) or haloperidol. (C) αSMA staining (red) of sections of tumor-bearing lungs in mice treated with either PBS (control) or haloperidol. Nuclei are stained blue with Hoechst. (D) Quantification of the tumor area in lungs of mice treated with either PBS or haloperidol (n = 5/gp). (E) Quantification of the number of tumor foci in lungs of mice treated with either PBS or haloperidol (n = 5/gp). (F) Quantification of αSMA+ area in tumor-bearing lungs of mice upon treatment with either PBS or haloperidol (n = 5/gp). (G) Representative images of Ki-67 (white) and αSMA (red) staining in sections of lung in COLL-EGFP mice (fibroblasts in green) treated with PBS (control) or haloperidol. Arrows indicate Ki-67+COLL-EGFP+αSMA+ cells. (H) Quantification of the Ki-67+αSMA+ myofibroblasts in lung cancer sections of COLL-EGFP mice treated with either PBS or haloperidol (n = 5/gp). Scale bars: 1 mm (B) and 50 μm (C and G). Values in D–F and H are mean ± SEM.*P < 0.05, ***P < 0.001 by unpaired t test.

