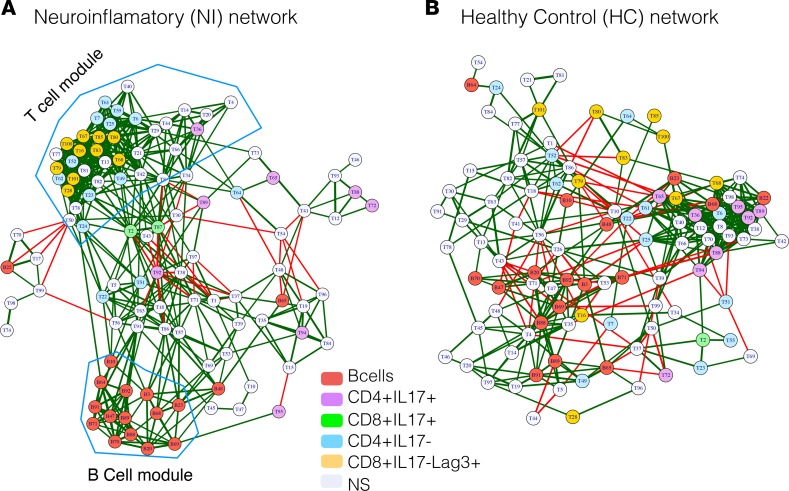
Figure 6. Coregulatory network of immune subsets in neuroinflammatory epileptic disease shows loss of negative regulatory edges and a highly modular structure.
Networks of nodes (cellular subsets) were created and plotted as force-directed layout. The color of the nodes indicates the cellular phenotypes: B cells, red); markedly altered CD4+IL-17+, purple; CD4+IL-17–,cyan; CD8+IL-17+, green; CD8+Lag3+ T cell nodes, yellow; and nonsignificant nodes (NS), light gray. The edges (lines connecting 2 nodes) represent the connections between the nodes. The colors of the edges indicate the correlation direction: red, negative; green, positive. (A) Network of immune cell subsets (nodes) from patients with neuroinflammatory (NI) epileptic disease. (B) Network of immune cell subsets (nodes) from healthy controls (HC).

