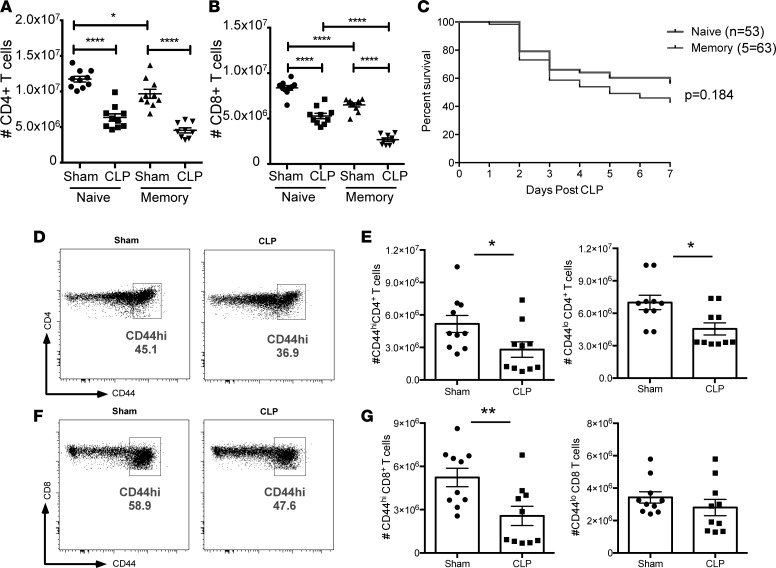
Figure 2. “Memory mice” exhibit significantly increased T cell loss during sepsis compared with naive hosts.
(A and B) Summary quantification of total number of CD4+ and CD8+ T cells in the spleen following sham or CLP surgery in either naive mice or memory mice generated as described in Figure 1. Groups (n = 10) were compared using a nonparametric, 2-way ANOVA. (C) Kaplan-Meier survival analysis of mortality in animals that had sepsis induced via CLP in either the presence or absence of memory T cells. (D) Representative flow cytograms indicating CD44 expression on CD4+ T cells after sham or CLP surgery. (E) Summary of total CD44hiCD4+ and CD44loCD4+ T cells, respectively, after sham or CLP surgery. (F) Representative flow cytograms indicating CD44 expression on CD8+ T cells after sham or CLP surgery. (G) Summary of total CD44hiCD4+ and CD44loCD8+ T cells, respectively, after sham or CLP surgery. In E and G, groups (n = 10) were compared with the Mann-Whitney nonparametric test. *P < 0.05, **P < 0.01, and ****P < 0.0001.

