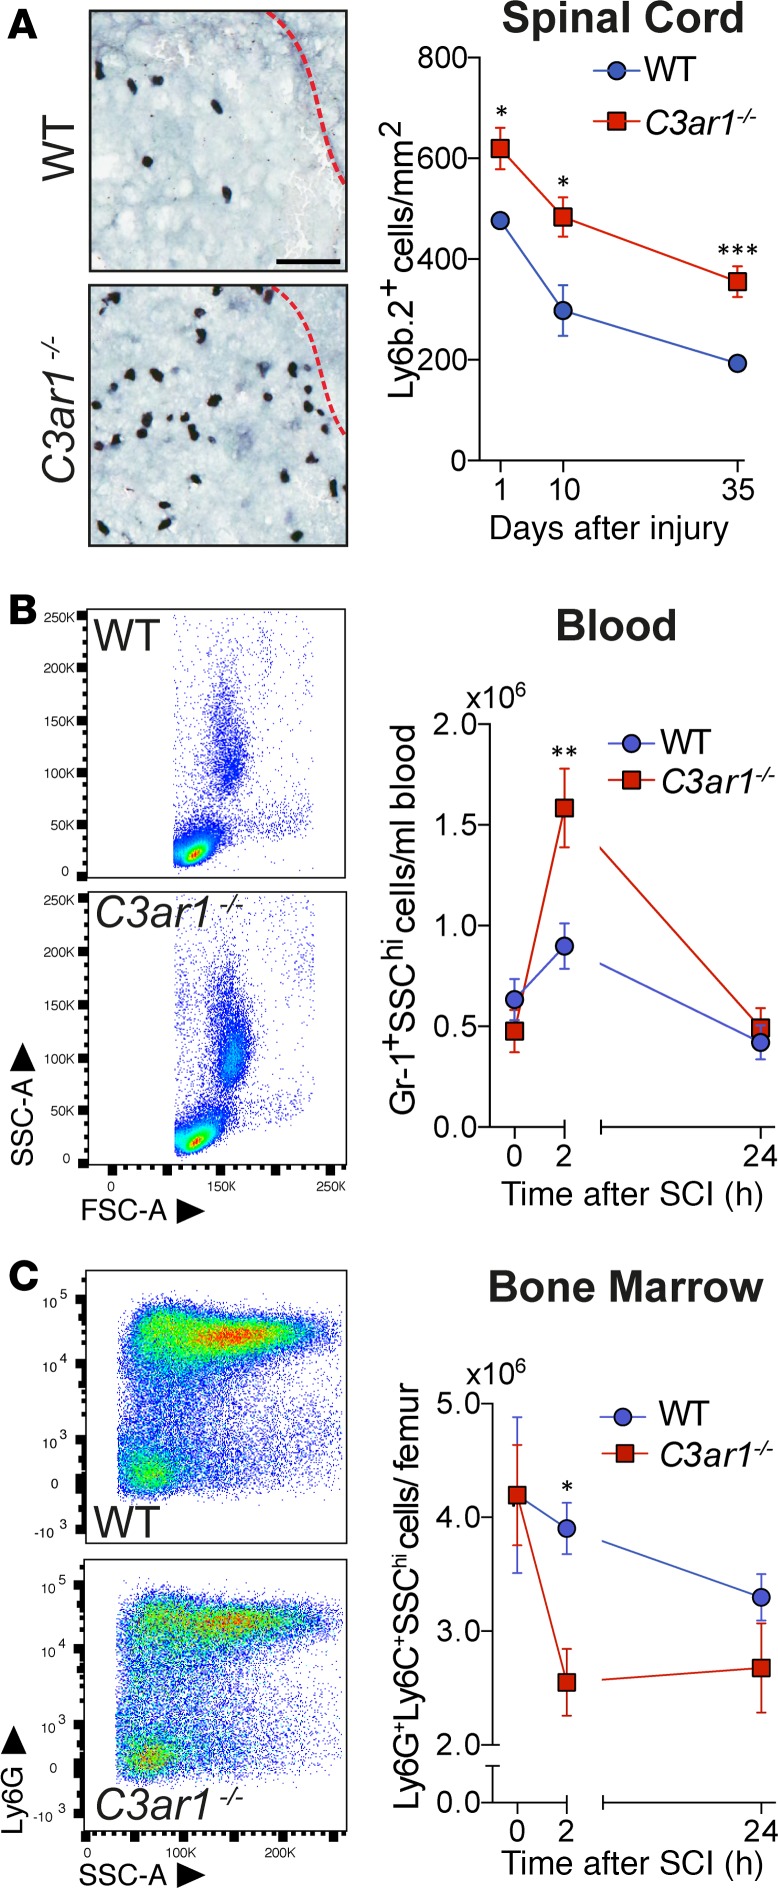
Figure 3. C3ar1–/– mice have increased neutrophil recruitment and display acute granulocytosis in response to SCI.
(A) Photomicrographs (left) and quantitative data (right) of the Ly6B.2+ infiltrate in WT and C3ar1–/– mice. Dashed red lines indicate the boundary between the dorsal columns and horns (1 day after SCI). Note that Ly6B.2+ cell numbers are significantly increased in the injured spinal cord of C3ar1–/– mice at 1, 10, and 35 days after SCI. Data points represent the mean ± SEM (n = 5–8). Scale bar: 50 μm. (B) Quantitative analysis of circulating blood granulocyte numbers acutely after SCI. Note the significant expansion of this population in C3ar1–/– mice at 2 hours after SCI. (C) BM granulocyte numbers were significantly lower in C3ar1–/– mice at 2 hours after SCI compared with their WT counterparts. Data points for B and C are mean ± SEM (n = 6 per genotype and time point). *P < 0.05; **P < 0.01; ***P < 0.001 by 2-way ANOVA with Bonferroni’s post hoc test for matching time points.

