Figure 2. Pancreatic cancer cell exosomes function as an initiator in malignant cell transformation.
(A) Two-stage cell transformation assay shown. NIH/3T3 cells were treated with a tumor initiator for 3 days (Days 3–6) and the tumor promoter for 2 weeks (Days 8–21). After 42 days, cells are fixed with methanol and stained with Crystal Violet for malignant foci counting. (B) Representative images of stained cells showing foci formation (arrows) from untreated cells and cells treated with MCA/DMSO, DMSO/TPA, MCA/TPA, or Capan-2 exosomes (ExC)/TPA (initiator/promoter). (C) Quantification of foci formed at the end of cell transformation assays. The average foci/well were determined via double-blind counting as described in Materials and methods. The red dashed line represents the established level of background foci present in untreated cells. Initiator/promoter treatments resulting in increased foci formation above background include MCA/TPA (p=0.008) and all cancer cell-derived exosomes: ExC/TPA (p=0.0002), ExM/TPA (p<0.0001), ExP/TPA (p=0.007), and ExBx/TPA (p=0.0003). Bars shown in gray represent controls that did not result in foci formation above background. Bar shown in pink shows results from normal cell (HPDE) exosome/TPA treatment (p=0.0004). (D) Quantification of foci formed after use of a different promoter, CdCl2. CdCl2 acts as a promoter leading to increased foci formation above background when used with the initiators MCA (p<0.0001) or Capan-2 exosomes (ExC) (p<0.0001). Asterisks indicate significant differences from either control treatment or MCA/TPA treatment as determined by unpaired, two-tailed t-test with Welch’s correction (*p<0.05; **p<0.01; ***p<0.001; ****p<0.0001). Red (+)=initiator used; purple (+)=promoter used.
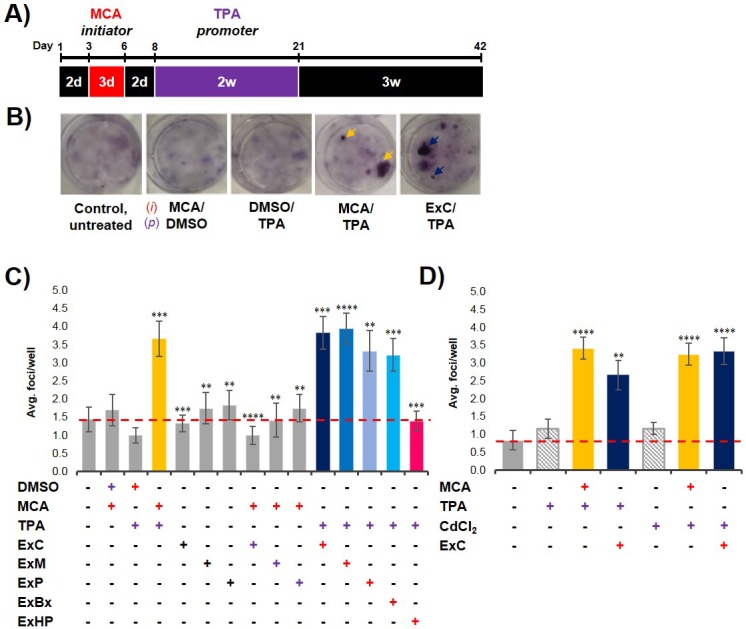
Figure 2—figure supplement 1. Characterization of initiation activity of pancreatic cancer cell exosomes.