
Figure 5. Principle component analysis (PCA) of transformed NIH/3T3 cells.
(A) PCA plot showing relationship between three MCA/TPA transformed foci, three Capan-2 exosome (ExC)/TPA transformed foci, three control foci from TPA-only treated NIH/3T3 cells, and three control foci from untreated NIH/3T3 cells. (B) PCA plot showing relationship between same three MCA/TPA transformed foci and Capan-2 exosome (ExC)/TPA transformed foci in the absence of control samples. Principle component analysis is based on comparison of exome-seq variant data using PLINK's identity-by-state (IBS) estimates.
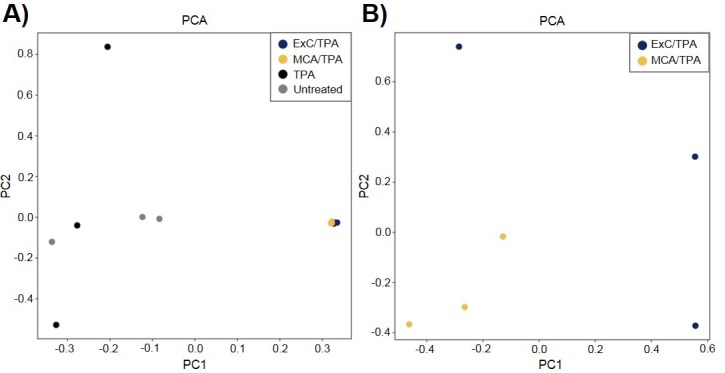
Figure 5—figure supplement 1. Variants found by Exome-sequencing analysis.
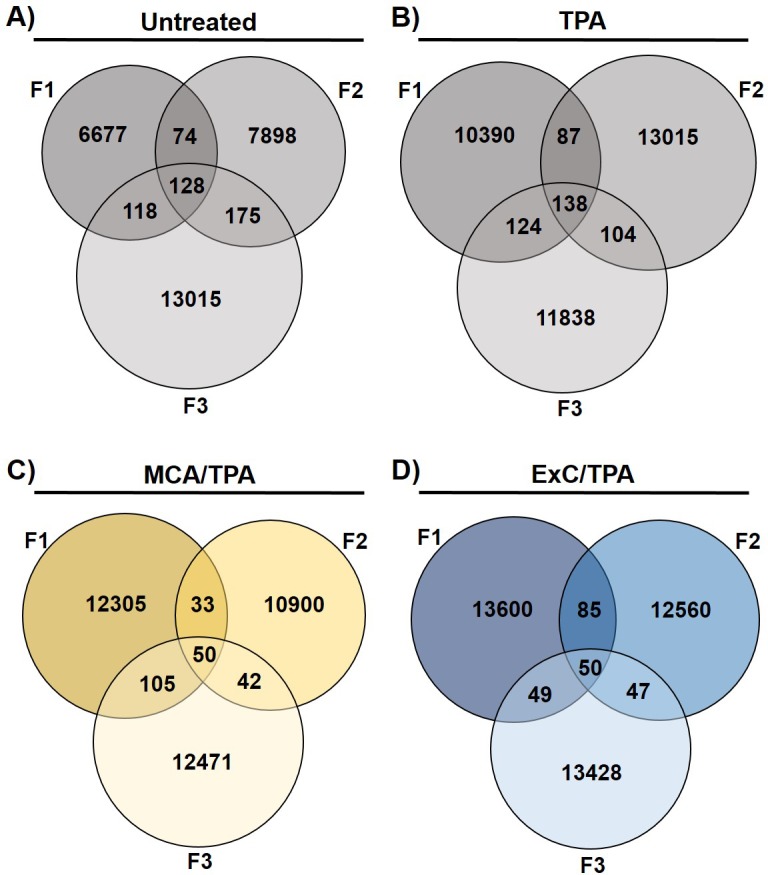
Total number of variants found in 12 samples sequenced by Exome-seq. Samples include transformed foci formed from four treatment conditions on NIH/3T3 cells: (A) untreated, (B) TPA-only treated, (C) MCA/TPA treated, and (D) Capan-2 exosome (ExC)/TPA treated.
Figure 5—figure supplement 1—source data 1. Relates to Figure 5—figure supplement 1.
Variants found in 190 oncogenes across all 12 samples analyzed in Figure 5.
elife-40226-fig5-figsupp1-data1.xlsx (102.3KB, xlsx)
DOI: 10.7554/eLife.40226.023