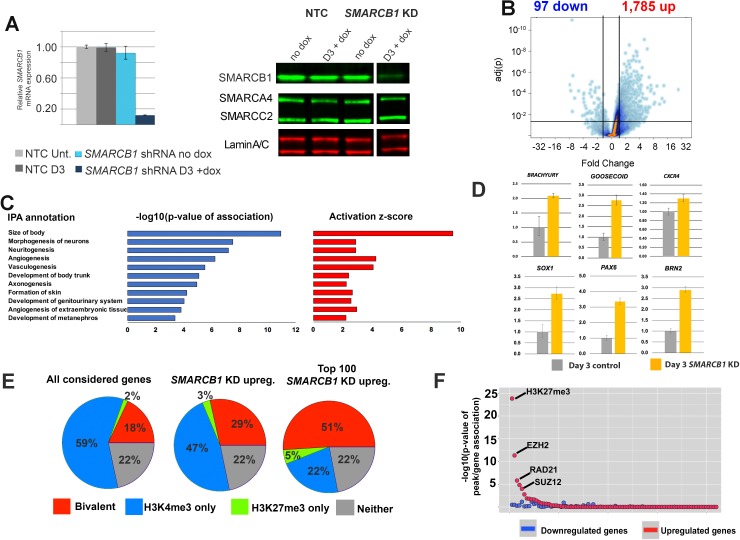
Figure 1. SMARCB1 is a transcriptional repressor of developmental bivalent genes.
(A) qPCR and western blot results showing SMARCB1 KD after 3 days (D3) of doxycycline treatment of inducible SMARCB1 shRNA-expressing H1 hESCs. Band order/spacing was modified from the original gel. qPCR results are relative to untreated NTC hESCs and are normalized to the geometric mean of 18S and GAPDH levels (B) Volcano plot showing the distribution of differentially expressed genes (q < 0.05, FC > 1.5) following 72 hr of SMARCB1. (C) IPA Organismal Development subcategories affected by SMARCB1 KD (q < 0.05, FC > 1.5), with respective activation scores and significance values. (D) qPCR data showing upregulation of early markers for all three germ layers following SMARCB1 KD. (E) Pie charts indicating the percentage of genes with the indicated histone marks, based on data from Pan et al. (2007), in all considered genes (left), those upregulated by SMARCB1 KD (middle), and the top 100 most upregulated genes following SMARCB1 KD (right). (F) Dot plot indicating the significance of intersection between ChIPseq peaks for transcription factors and histone modifications in hESCs and the TSS (±2.5 kb) of genes significantly affected by SMARCB1 KD. The plot is ordered with the ChIPseq peaks most significantly associated with upregulated gene TSS on the left.


