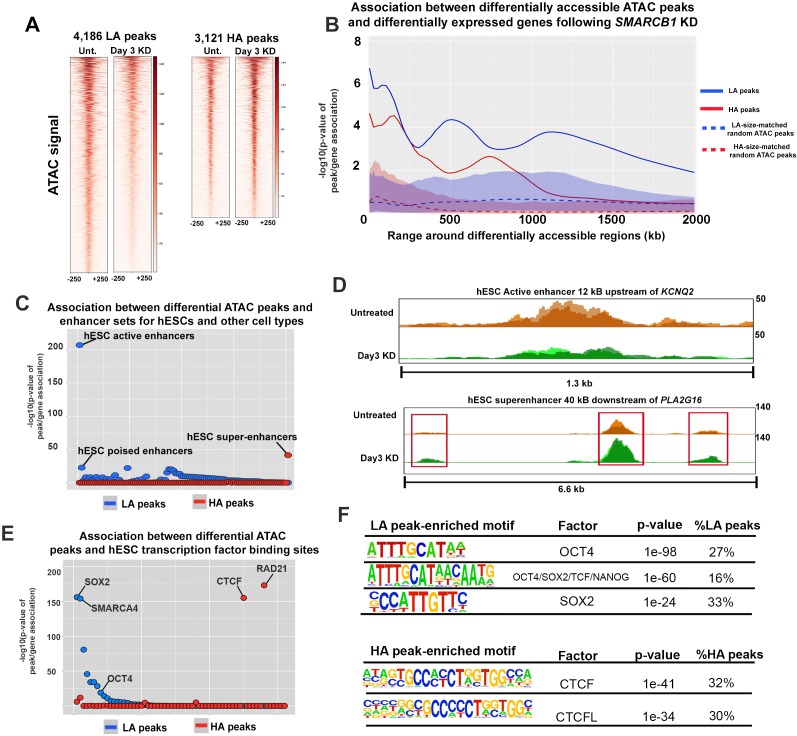
Figure 2. SMARCB1 negatively regulates accessibility at key pluripotency regions in hESCs.
(A) Heatmaps showing the ATAC signal over the peaks with lower (LA) and higher (HA) accessibility (q < 0.05, FC > 1.5) prior to (Unt.) and following 72 hr of SMARCB1 KD. (B) Plot of the significance of the association between SMARCB1 KD lower/higher accessibility peaks (solid lines) and down/up-regulated genes, respectively, by RNAseq (q < 0.05, FC > 1.5) over 2 Mb kb. The blue/red-shaded regions reflect the 5–95% confidence interval (CI) for the significance of the association between down/up-regulated genes and 1000x sets of randomly selected hESC ATAC peaks that were matched in size and number to the lower/higher accessibility ATAC peak sets. The dotted lines indicate the median of the random peak set-based significance range. (C) Dot plot of the significance of the association between SMARCB1 KD lower/higher accessibility peaks and human enhancer regions. The plot is ordered with the enhancer regions most significantly associated with lower accessibility peaks on the left. (D) Top: ATAC signal tracks for untreated and 72 hr SMARCB1 KD cells over an active hESC enhancer 12 kB upstream of KCNQ2. Bottom: ATAC signal tracks for untreated and 72 hr SMARCB1 KD cells over an hESC super-enhancer with three higher accessibility peaks, 40 kB downstream of PLA2G16. (E) Dot plots indicating the significance of intersection between SMARCB1 KD lower/higher accessibility peaks and hESC transcription factor binding sites. The plot is ordered with the ChIPseq peaks most significantly associated with lower accessibility peaks on the left. (F) Top: Pluripotency factor related motifs that are significantly enriched in lower accessibility peaks following SMARCB1 KD, as well as the significance of the association and the percentage of these peaks that contain the motif. Bottom: The significance of the association and the percentage of higher accessibility peaks that contain CTCF and CTCFL motifs following SMARCB1 KD, as well as the significance of the association and the percentage of these peaks that contain the motif.


