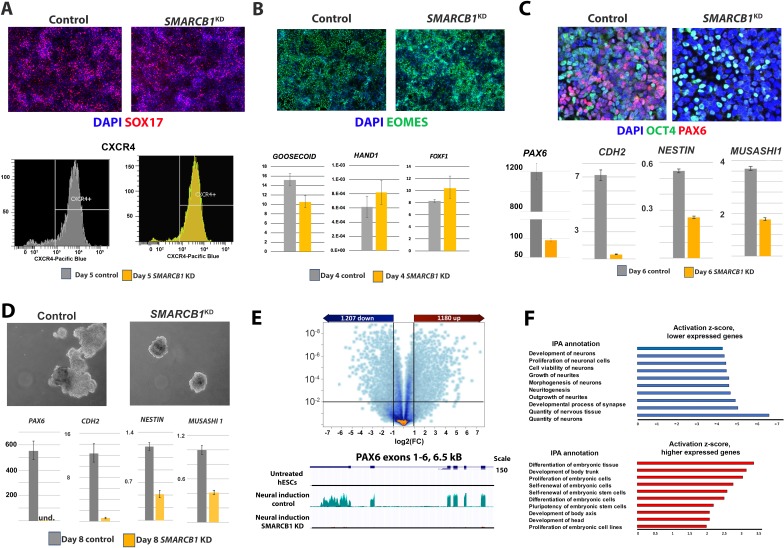
Figure 3. SMARCB1 KD prevents neural induction and upregulation of neural differentiation-related genes.
(A) Top: Control and SMARCB1 KD cells subjected to a 5 day definitive endoderm protocol induction protocol stained for SOX17 (red) and with DAPI (blue). Bottom: Flow cytometry histograms showing similar percentages of CXCR4+ cells in control and SMARCB1 KD cells subjected to this protocol. (B) Top: Control and SMARCB1 KD cells subjected to a 4-day mesodermal induction protocol stained for EOMES (green) and with DAPI (blue). Bottom: qPCR analysis of control and SMARCB1 KD cells subjected to the same protocol for the early mesodermal markers GOOSECOID, HAND1, and FOXF1. All qPCR results are relative to steady state hESCs and are normalized to the geometric mean of 18S and GAPDH levels. (C) Top: Control and SMARCB1 KD cells subjected to a 6 day directed neural induction protocol stained for PAX6 (red), OCT4 (green), and with DAPI (blue). Bottom: qPCR analysis showing a failure of SMARCB1 KD cells to upregulate neural differentiation markers PAX6, CHD2, NESTIN, and MS1. (D) Top: Control and SMARCB1 KD embryoid bodies (EBs) subjected to a neural induction protocol. Bottom: qPCR analysis showing a failure of SMARCB1 KD cells to upregulate the neural differentiation markers PAX6, CHD2, NESTIN, and MS1. (E) Top: Volcano plot illustrating the extent and significance of differential gene expression between control and SMARCB1 KD cells subjected to neural induction protocol as determined by RNAseq (q < 0.01 and FC > 2.0). Bottom: RNAseq tracks PAX6 for steady state hESCs as well as control and SMARCB1 KD cells subjected to a monolayer neural induction protocol. Flat lines indicate undetectable or nearly undetectable expression at the scale used. (F) Top: Activation scores for IPA Nervous System Development sub-categories, considering genes expressed at lower levels in SMARCB1 KD cells compared to controls following the neural induction protocol. Bottom: Activation scores for IPA Embryonic Development sub-categories, considering genes expressed at higher levels in levels in SMARCB1 KD cells compared to controls following the neural induction protocol.


