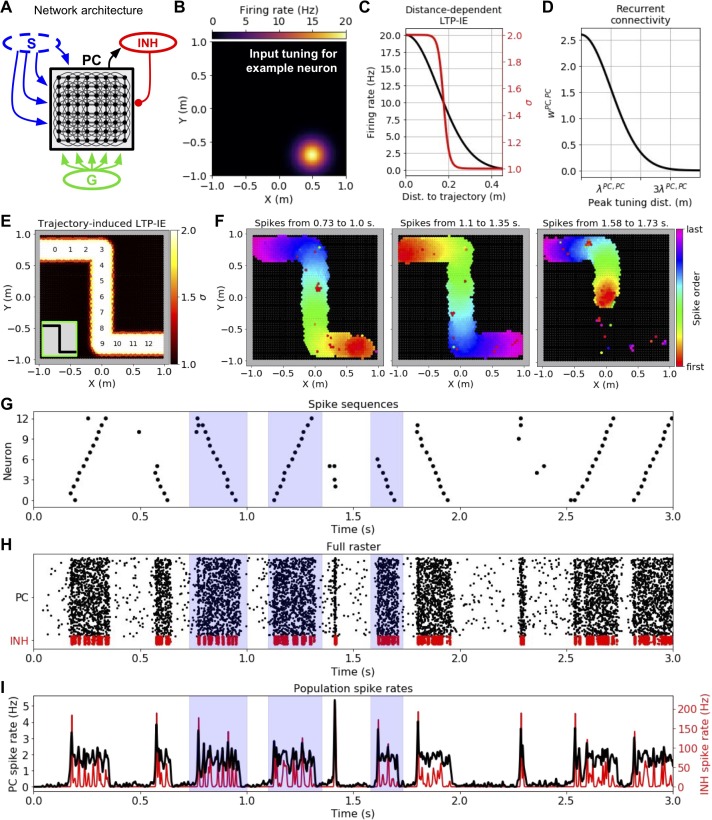
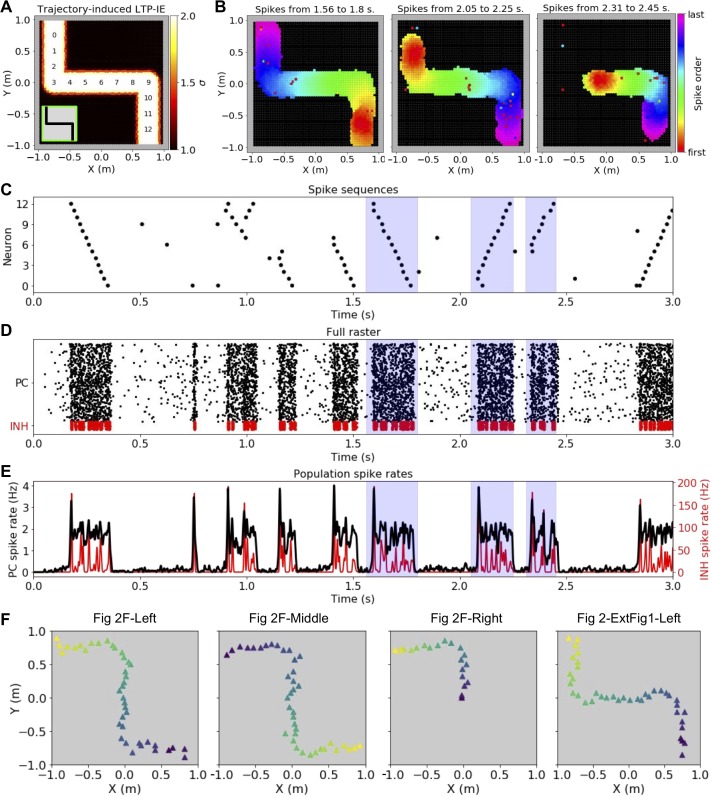
Figure 2. Demonstration of history-dependent sequence replay via LTP-IE.
(A) Network architecture used in simulations. The dashed oval around input S indicates that we did not explicitly simulate its interaction with the pyramidal cell (PC) network, but rather only the LTP-IE profile one would expect following the termination of S input. (B) Squared exponential position tuning for an example neuron (20 Hz max. firing rate, 0.15 m length scale). (C) Resultant LTP-IE as a function of distance between a cell’s maximum tuning and the closest point on the trajectory through the environment (red), computed as a sigmoidal function (Figure 1B) of position-dependent firing rate (black). (D) Recurrent excitatory weights between PCs as squared exponential function of distance between the two cells’ peak tuning positions. (E) LTP-IE profile induced in PCs by an example Z-shaped trajectory (inset) in a network of 3000 PC and 300 inhibitory (INH) cells. PCs are positioned according to peak tuning and colored by the LTP-IE level (σ) expected to result from the trajectory. The numbers indicate the position tunings of the PC identifiers in G. (Note: individual cells cannot be seen here due to their high density). (F) Cells activated during the different spontaneous replay events shaded in blue in G-I, colored by the order of the first spikes each cell emitted during the event. Black cells did not activate during replay. Left and middle: replay in two different directions; right: partial replay. G. Partial raster showing spike times for cells with position tunings marked in E. H. Full raster plot for PC and INH population over a 3 s trial. I. Cell-averaged spike rates for PC and INH populations throughout trial.


