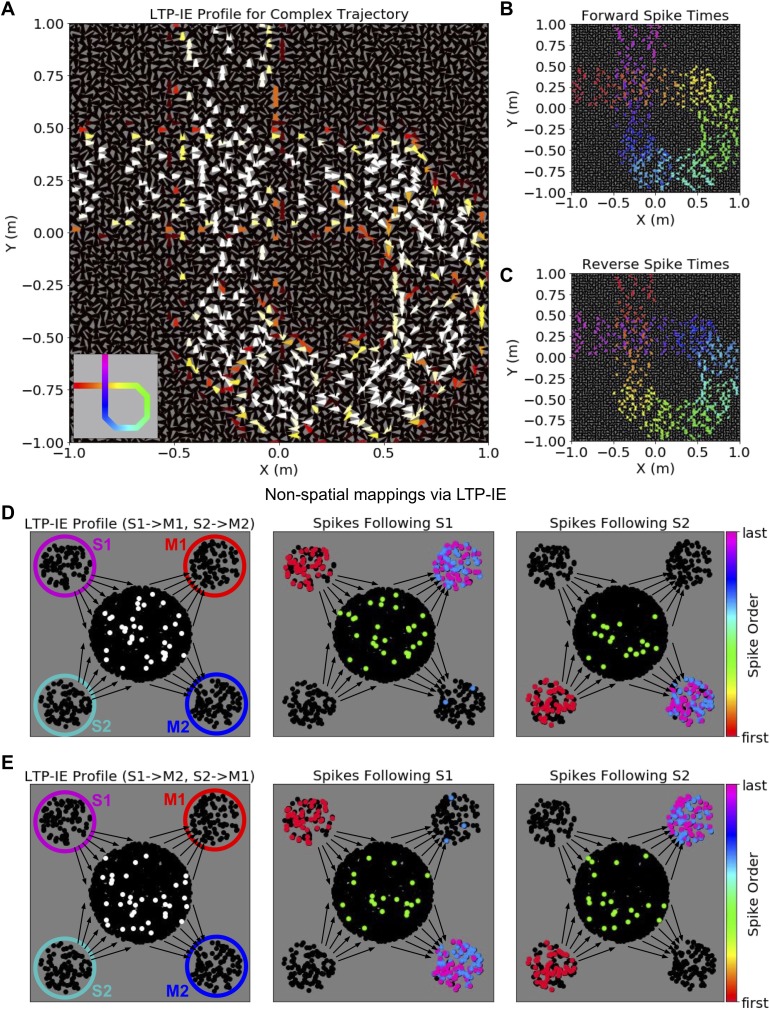
Figure 5. Complex sequences and non-spatial mappings via LTP-IE in our reduced network model.
(A) LTP-IE profile for self-intersecting trajectory in a network with cells tuned to both position and head direction. Each triangle corresponds to a single cell, with location indicating position tuning and triangle orientation indicating head-direction tuning. This LTP-IE profile corresponds to a ‘gamma’-shaped trajectory (inset) beginning at (−1,. 25) m and ending at (−0.25, 1) m, and which intersects itself at (−0.25,. 25) m. (B) ‘Forward’ cell activation sequence given the network and LTP-IE profile in A, triggered by current injection into cells with tuning near (−1,. 25) m. (C) ‘Reverse’ cell activation sequence given the network and LTP-IE profile in A, triggered by current injection into cells with tuning near (−0.25, 1) m. Colors in B, C indicate spike order, with same color code as in 2F. (D) Left: LTP-IE profile for one mapping between two stimuli (S1, S2) and two responses (M1, M2) in a network without spatial organization. (The only neurons tagged by LTP-IE were the ones shown in white, which had an LTP-IE level of σ = 2.) Each stimulus (magenta, cyan) or response (red, blue) is represented by an ensemble of 100 neurons, with the ‘switchboard ensemble’ containing 2000 neurons (recurrence with M1, M2 exists but is not depicted here); middle: spike order following current injection into the S1 neurons, leading to subsequent activation of M1; right: spike order following current injection into the S2 neurons, leading to subsequent activation of M2. (E) Left: As in D-Left, but with an LTP-IE profile encoding the opposite mapping from D; middle: spike order following current injection into the S1 neurons, leading to subsequent activation of M2; right: spike order following current injection into the S2 neurons, leading to subsequent activation of M1.

