. 2019 May 9;8:e47746. doi: 10.7554/eLife.47746

Figure 3. State-dependent changes at the cytoplasmic inter-protomer interface.

(A–B) Top view of the cytoplasmic inter-protomer interactions in TRPV3WT (A) and TRPV3K169A (B). In TRPV3WT the CTD (red) coils around the βCD (grey). The distal CTD interacts with the ARD at the front of the interface and with the loop of ankyrin repeat 5 (AR5, magenta) at the back. In TRPV3K169A, the interface is changed due to the coil-to-helix transition in the distal CTD, which no longer participates in the interactions at the front of the interface and forms tighter interactions with AR5. The front of the interface is now occupied by the putative NTD (yellow). (C) A close-up view from the cytoplasmic cavity of the interactions between the distal CTD (red surface representation) and AR5 (magenta surface representation) in TRPV3WT. Residue W739 forms a cation-π interaction with the amino group of Q313 (dashed line). (D) The coil-to-helix transition changes the conformation of the AR5 loop. In TRPV3K169A, the W739-Q313 interaction is broken. Residues K742 and W743, which in TRPV3WT are not within interaction distances with the rest of the protein, form interactions with the backbone of E308 in AR5 and P384 in βCD, respectively (dashed lines). Representative whole-cell current traces recorded at +60 mV from W739A (E), W742A (F), and K743A (G) evoked by repeating applications 30 μM 2-APB for 15 s followed by 15 s of washout. (H) Average current density for the first five 2-APB stimulations (W739A: n = 6 biologically independent experiments; W742A: n = 6 biologically independent experiments; K743A: n = 5 biologically independent experiments). (I) Ratio of first (I0) and maximum current (Imax) 2-APB stimulation (Imax/I0) as in (G), calculated as the mean from each biologically independent experiment (W739A: n = 6 biologically independent experiments). (J) Mean 2-APB EC50 from three consecutive dose-response rounds fit with the Hill equation (WT: n = 5 biologically independent experiments; W742A: n = 5 biologically independent experiments; K743A: n = 4 biologically independent experiments). See Figure 3—figure supplement 2 for representative current traces and dose–response relationship fit with the Hill equation.

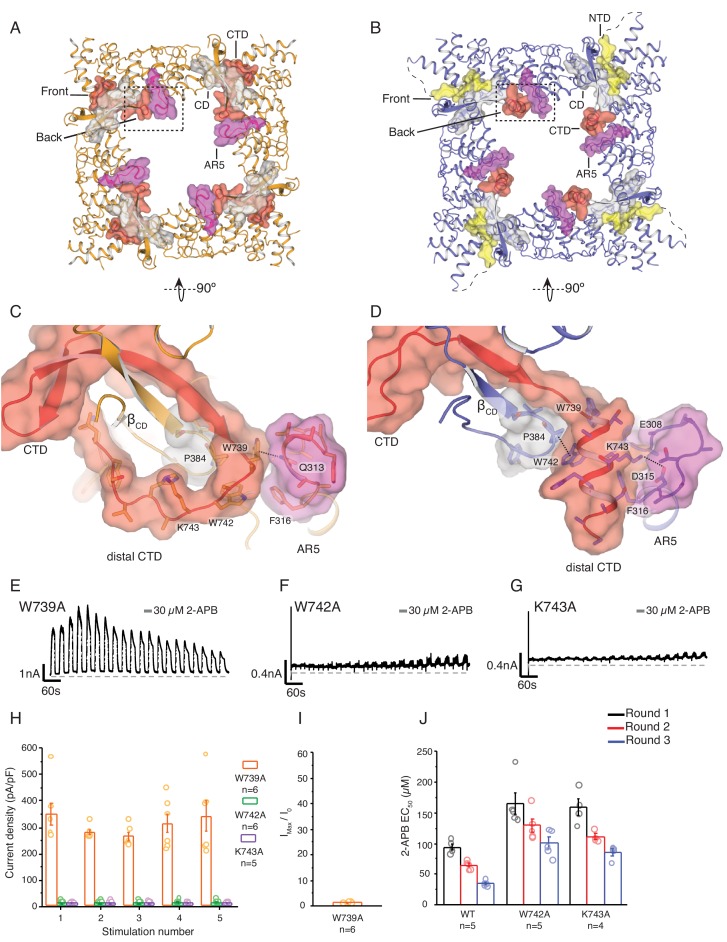
Figure 3—source data 1. This spreadsheet contains current density data used to generate bar plots in Figure 3H; initial sensitization data used to generate bar plots in Figure 3I; calculated dose-response values used to generate bar plots in Figure 3J.
DOI: 10.7554/eLife.47746.013

Figure 3.

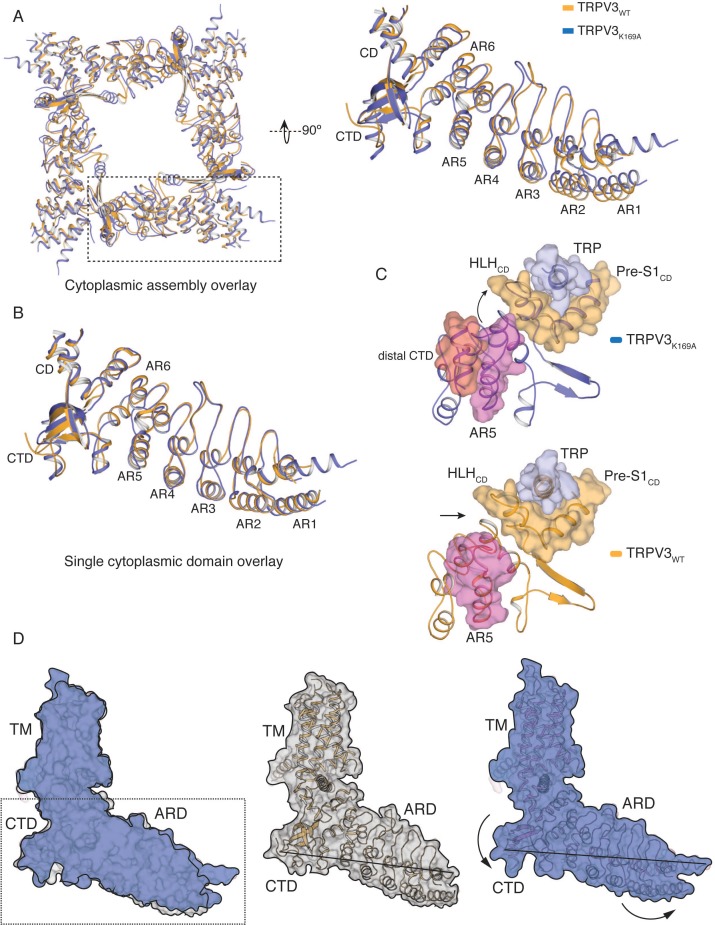
Figure 3—figure supplement 1. Conformational changes in the cytoplasmic domains in TRPV3K169A.

Figure 3—figure supplement 1.

(A) Overlay of the tetrameric cytoplasmic assemblies from TRPV3WT (orange) and TRPV3K169A (blue). Close-up view single ARD shows that the tetrameric assemblies cannot be superposed through a rigid body rotation. (B) Individual ARDs, not attached to the tetrameric assembly, from TRPV3WT (orange) and TRPV3K169A (blue) can be superposed. (C) In the TRPV3WT (orange, bottom) structure there is no coupling between the AR5 (magenta) and the HLHCD (orange). However, in TRPV3K169A (blue, top) upon coil-to-helix transition in the distal CTD (red), the CTD-AR5 (magenta) interaction forces a change in conformation in the loop of AR5, bringing it within interaction distance of HLHCD (orange). (D) Surface representation of the overlay between single protomers of TRPV3WT (orange cartoon, gray surface) and TRPV3K169A (blue cartoon, blue surface). The overlay shows that the TM domains overlay well, while the cytoplasmic domains exhibit substantial differences. The cytoplasmic assembly of TRPV3K169A (right panel) swivels, so that the N-terminal part is lifted up toward the membrane while the C-terminal part is lowered into the cytosol. The line drawn between the tip of the βCD and residue A110 in AR1 indicates the relative movement within the cytoplasmic assembly.
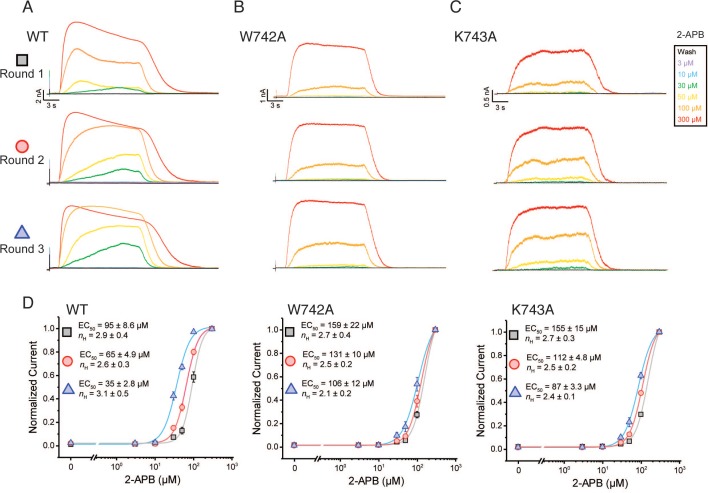
Figure 3—figure supplement 2. The TRPV3 W742A and K743A CTD mutants alter hysteresis.

Figure 3—figure supplement 2.

Three consecutive rounds of 2-APB dose-responses (0 (black) 3(purple), 10 (blue), 30 (green), 50 (yellow), 100 (orange), 300 (red) μM) was applied for 15 s followed 15 s of wash for WT (A) W742A (B) and K743A (C) at +60 mV. (D) Averaged dose-response of WT, W742A, and K743A from the first (square), second (circle), and third (triangle) consecutive dose-response round. Inset is EC50 and hill coefficient (nH) fitted to the average normalized current at each 2-APB concentration per round (WT: n = 5 biologically independent experiments; W742A: n = 5 biologically independent experiments; K743AA: n = 4 biologically independent experiments).
Figure 3—figure supplement 2—source data 1. This spreadsheet contains dose-response data used to calculate mean values plotted in Figure 3—figure supplement 2D.
DOI: 10.7554/eLife.47746.012