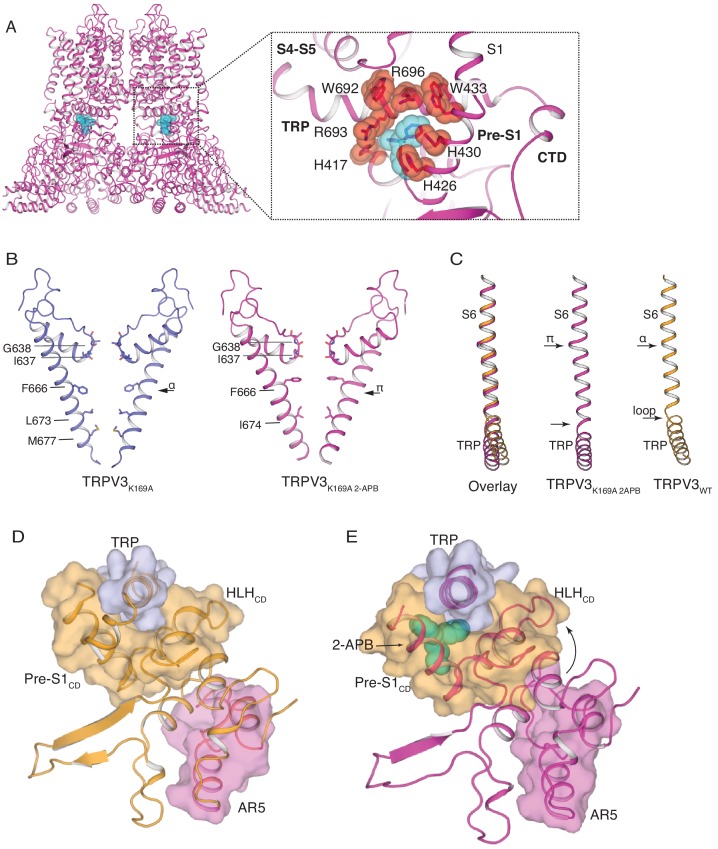
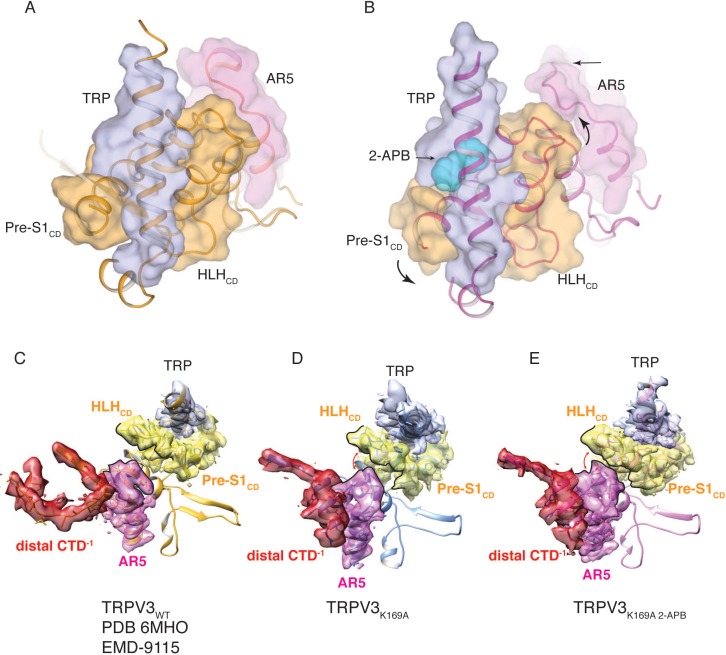
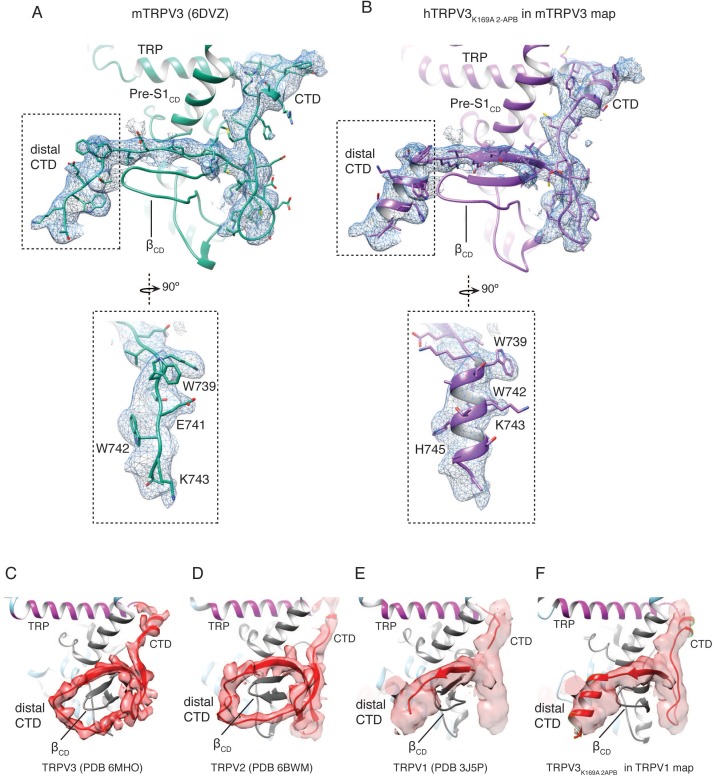
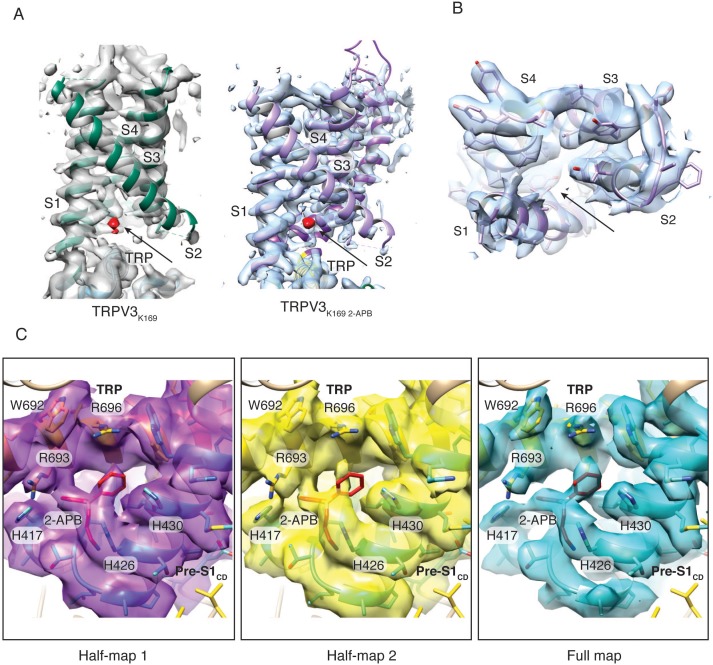
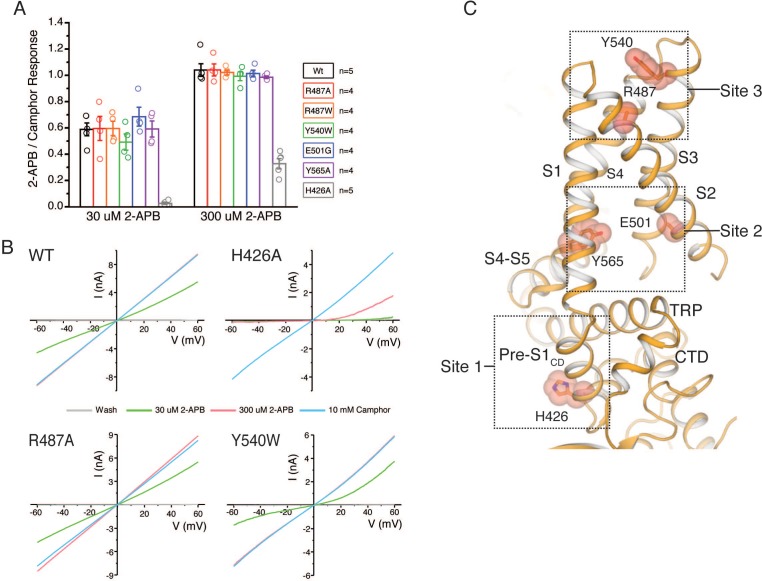
Figure 4. The structure of TRPV3K169A 2-APB exhibits changes in both transmembrane and cytoplasmic domains.
(A) One 2-APB molecule is bound to each protomer of the TRPV3K169A 2-APB channel (magenta). 2-APB is found between the HLHCD, Pre-S1CD and TRP domains in a binding site defined by residues H417 in the HLHCD, H426, H430, W433 in the Pre-S1CD and W692, R693 and R696 in the TRP domain. All residues are shown in stick and red sphere representation. 2-APB is shown in stick and cyan sphere representation. (B) The S6 helix of TRPV3K169A (blue) undergoes an α-to-π transition in the presence of 2-APB (magenta). (C) The α-to-π transition tightens the connection between S6 and the TRP domain. In the TRPV3WT structure (orange), the TRP domain and the S6 are connected via a loop, but in the TRPV3K169A 2-APB channel (magenta) the TRP domain and S6 form a continuous helical structure. In addition, the TRP domain exhibits a swivel in the TRPV3K169A 2-APB structure. (D–E) The coil-to-helix transition in TRPV3K169A 2-APB increases coupling between the cytoplasmic domains and the TRP domain. In the TRPV3WT structure (orange) (D), the loop of AR5 (magenta surface) does not interact with the HLHCD (orange surface). However, in TRPV3K169A 2-APB (magenta) (E) the coil-to-helix transition in the distal CTD induces a conformational change in the loop of AR5 (magenta surface), coupling it to the HLHCD (orange surface) and the TRP domain (light blue surface). 2-APB (cyan stick and surface representation) contributes to increased interactions between the TRP domain and Pre-S1CD.

