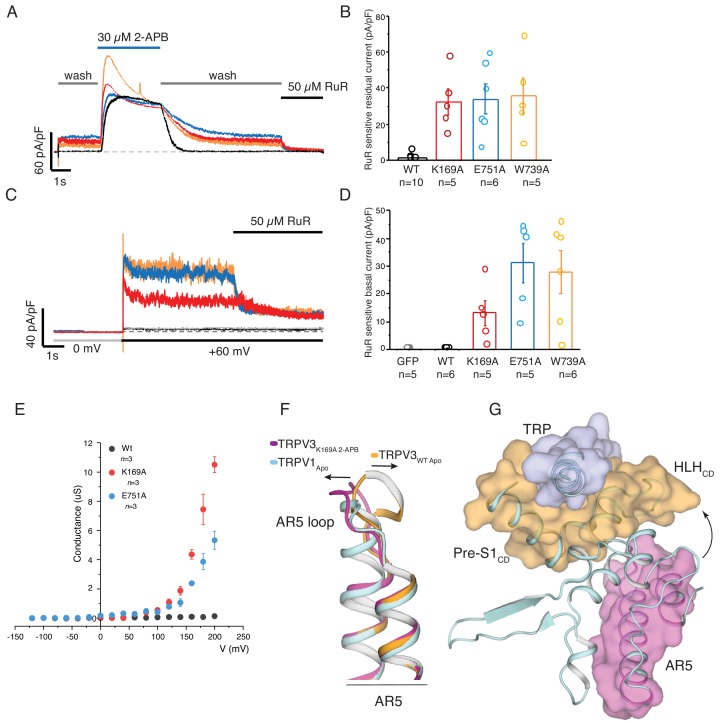
Figure 5. Parallels between TRPV3K169A and wild-type TRPV1.
(A) Representative whole-cell recording at +60 mV of WT (black), K169A (red), E751A (blue), W739A (orange) immediately following 2-APB sensitization protocol, with perfusion protocol of 5 s wash, followed by 15 s 30 μM 2-APB, prolonged 30 s wash and the residual current was blocked by 5 s application of 50 μM ruthenium red (RuR). The scale bars units are in current density (pA/pF). (B) Graphical representation of RuR sensitive residual current at the end of the recording in (A) (WT: n = 10 biologically independent experiments; K169A: n = 5 biologically independent experiments; E751A: n = 6 biologically independent experiments, W739A: n = 5 biologically independent experiments). (C) Basal current activity before application of ligand was determined by the blocking the current following a voltage step from 0 to +60 mV with 50 μM RuR. (D) Graphical representation of the mean blocked current density from the protocol in (C) (GFP control: n = 5 biologically independent experiments; WT: n = 6 biologically independent experiments; K169A: n = 5 biologically independent experiments; E751A: n = 5 biologically independent experiments, W739A: n = 6 biologically independent experiments). (E) Conductance voltage relation of WT, K169A, and E751A in the absence of ligand determined from peak tail current elicited from a −160 mV post step pulse following a voltage step between −120 to +200 mV (Δ 20 mV). The conductance of both mutants fail to saturate at +200 mV while WT channels are nonconductive at the tested voltages (WT: n = 3 biologically independent experiments; K169A: n = 3 biologically independent experiments; E751A: n = 3 biologically independent experiments). (F) Alignment of AR5 from TRPV3WT (orange), TRPV3K169A 2APB (magenta) and TRPV1 (light cyan). The AR5 loop of TRPV1 assumes a conformation similar to that of TRPV3K169A 2APB. (G) The AR5 loop and the HLHCD are within interaction distance in TRPV1.


