. 2019 Apr 8;8:e42374. doi: 10.7554/eLife.42374

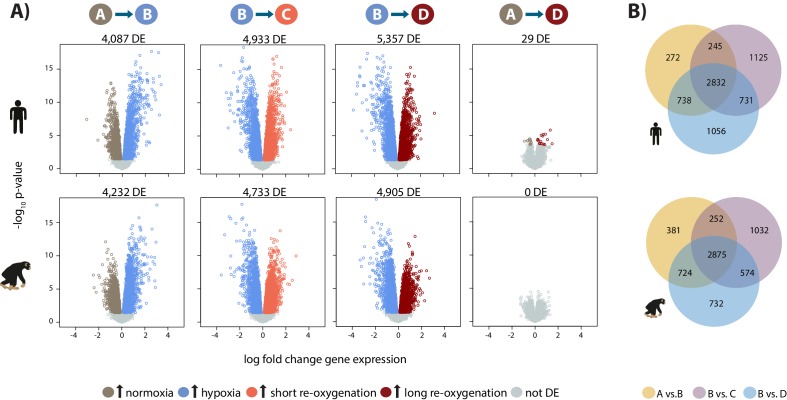
Figure 2. Hypoxia induces a gene expression response in humans and chimpanzees.

(A) Volcano plots representing genes that are differentially expressed (DE; 10% FDR) in pairwise comparisons across conditions in each species independently. In a comparison of A vs. B, genes that are up-regulated in hypoxia are represented in blue, and genes that are up-regulated in normoxia are represented in brown. Genes that are up-regulated in condition C are represented in coral, and genes that are up-regulated in D are represented in dark red. (B) Overlap of genes that are differentially expressed in pairs of conditions in each species independently. Also see Figure 2—figure supplements 17.

Figure 2.

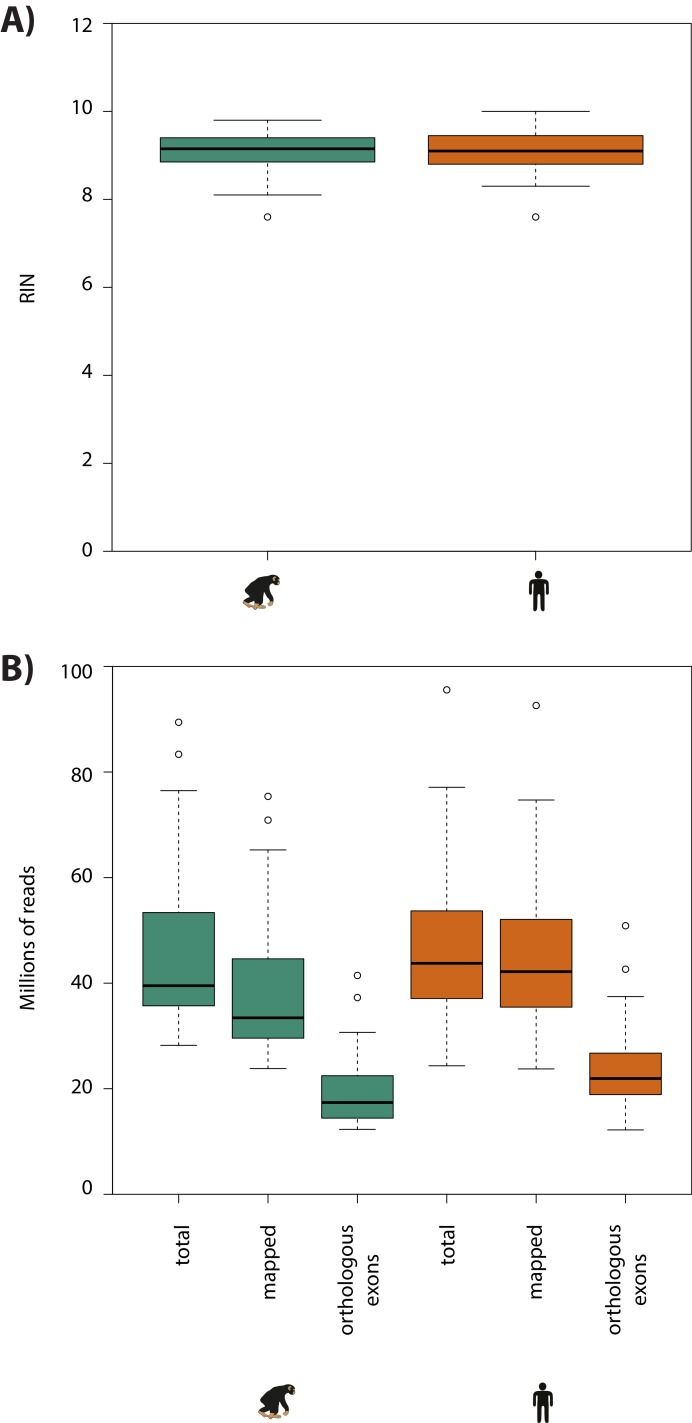
Figure 2—figure supplement 1. RNA-seq sample quality is similar between species.

Figure 2—figure supplement 1.

(A) RNA integrity levels across all human and chimpanzee samples. (B) The total number of RNA-seq reads, the number of reads aligned to each species’ genome, and the number of reads that map to orthologous exons is shown for each species.
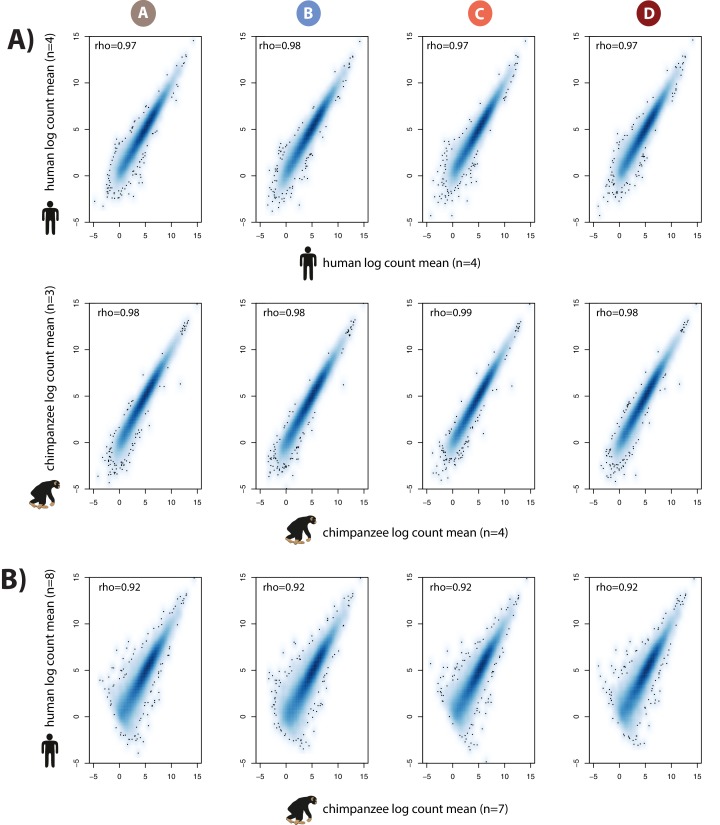
Figure 2—figure supplement 2. Inter-species variability in read counts is greater than intra-species variability.

Figure 2—figure supplement 2.

(A) Spearman correlation of per-gene RNA-seq read counts between individuals of the same species within a condition. Mean read counts per gene in four human individuals versus mean read counts per gene in four independent human individuals are shown in the top panel. Mean read counts in four chimpanzee individuals versus mean read counts in three independent chimpanzee individuals are shown in the lower panel. Each column represents one of the four conditions – A, B, C and D. (B) Mean chimpanzee (seven individuals) read counts versus mean human (eight individuals) read counts.
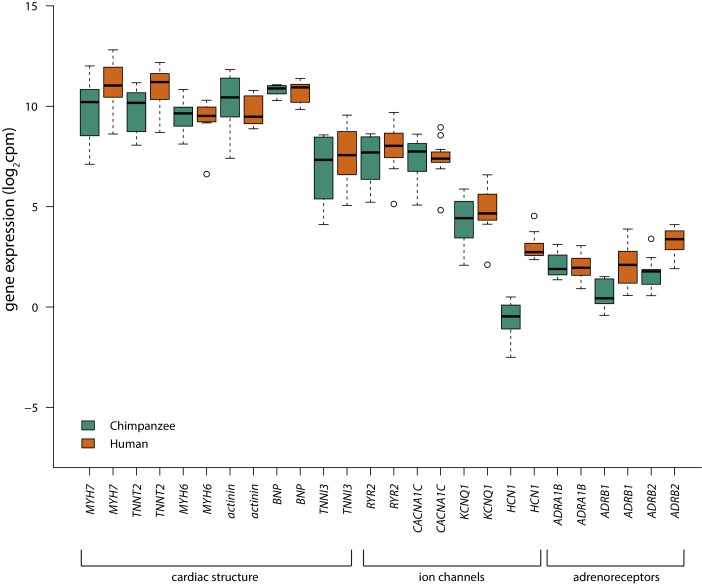
Figure 2—figure supplement 3. Range of cardiomyocyte genes are expressed in human and chimpanzee iPSC-CMs.

Figure 2—figure supplement 3.

Log2cpm values of cardiac structure, ion channel and adrenoreceptor genes expressed in cardiomyocytes (Burridge et al., 2014) in human (orange) and chimpanzee (green) iPSC-CM samples. Condition A (normoxia) values are plotted for each sample.
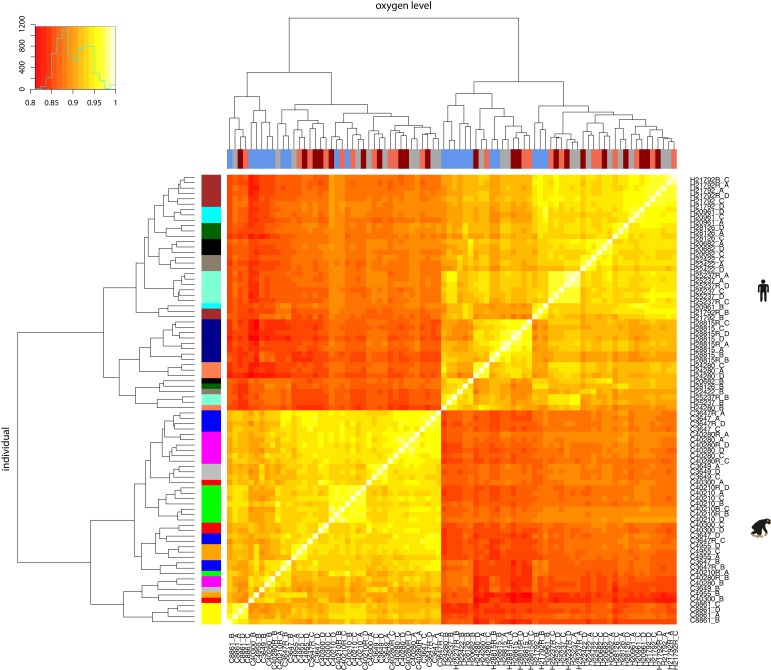
Figure 2—figure supplement 4. RNA-seq samples cluster by species and then by oxygen level or individual.

Figure 2—figure supplement 4.

Spearman correlation of between-sample RUVs-normalised log2cpm values. X-axis bar represents the oxygen level: brown: 10% oxygen baseline (A), blue: 6 hr after 1% oxygen (B), coral: 6 hr of re-oxygenation at 10% oxygen after hypoxia (C), dark red: 24 hr of re-oxygenation at 10% oxygen after hypoxia (D). Y-axis bar represents the individual: each colour represents the individual from which the samples came. There are four samples per individual except for the six individuals with replicates, which have eight samples.
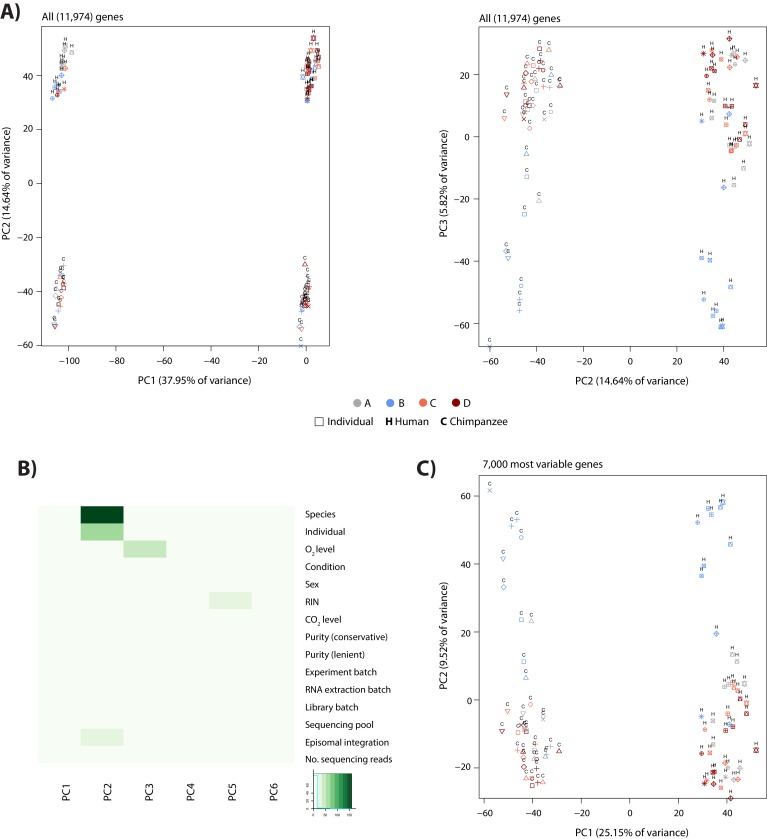
Figure 2—figure supplement 5. Species and individual are most correlated with the first two principal components in PCA.

Figure 2—figure supplement 5.

(A) PCA of the corrected RNA-seq count data (RUVs-normalized counts following removal of four factors of unknown variation) showing the first three PCs. Colours indicate condition, while shapes indicate the individual, which the samples came from. Human samples are designated by ‘H’ and chimpanzee samples by ‘C’. (B) Significance of the correlation between various biological and recorded technical factors and the first six principal components following PCA. –log10p values are plotted. (C) PCA including only the 7,000 most variable genes in the analysis.
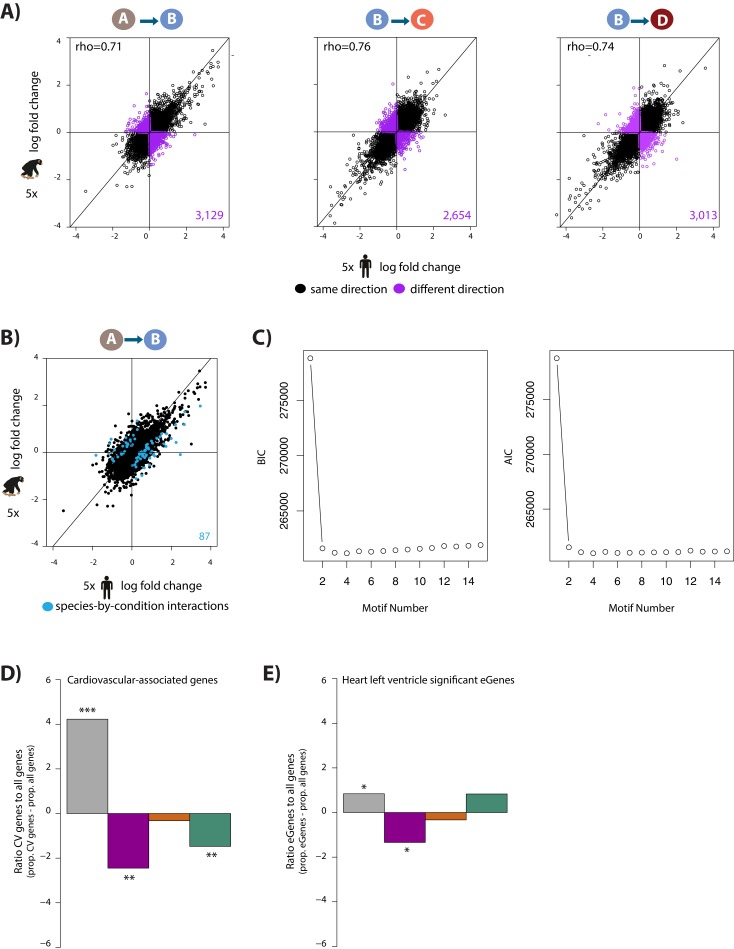
Figure 2—figure supplement 6. Inter-species results are recapitulated using a subset of the data.

Figure 2—figure supplement 6.

(A) The log fold change in expression of 11,974 genes between pairs of conditions in five humans on the x-axis, and five chimpanzees on the y-axis. All samples are free of episomal reprogramming vector. Genes whose expression change is in the same direction in both species are shown in black, and genes whose expression change direction differs between species are shown in purple. (B) The log fold change in expression of 11,974 genes between normoxia (A) and hypoxia (B) in humans on the x-axis, and chimpanzees on the y-axis. Genes with a species-by-condition interaction are represented in blue. (C) BIC and AIC associated with increasing the number of ‘correlation motifs’ in Cormotif. D) The proportion of cardiovascular-associated genes (CV) (Cardiovascular GO Annotation Initiative) in each response category: non-response (grey), conserved response (magenta), human-specific response (orange), and chimpanzee-specific response (green), relative to the proportion of all genes in each category. (E) The proportion of heart left ventricle eGenes in each response category, relative to the proportion of all genes in each category (GTEx Consortium). Asterisk denotes a significant difference between cardiovascular genes/eGenes in each response category, and all genes within a response category (*p<0.05, **p<0.005, ***p<0.0005).
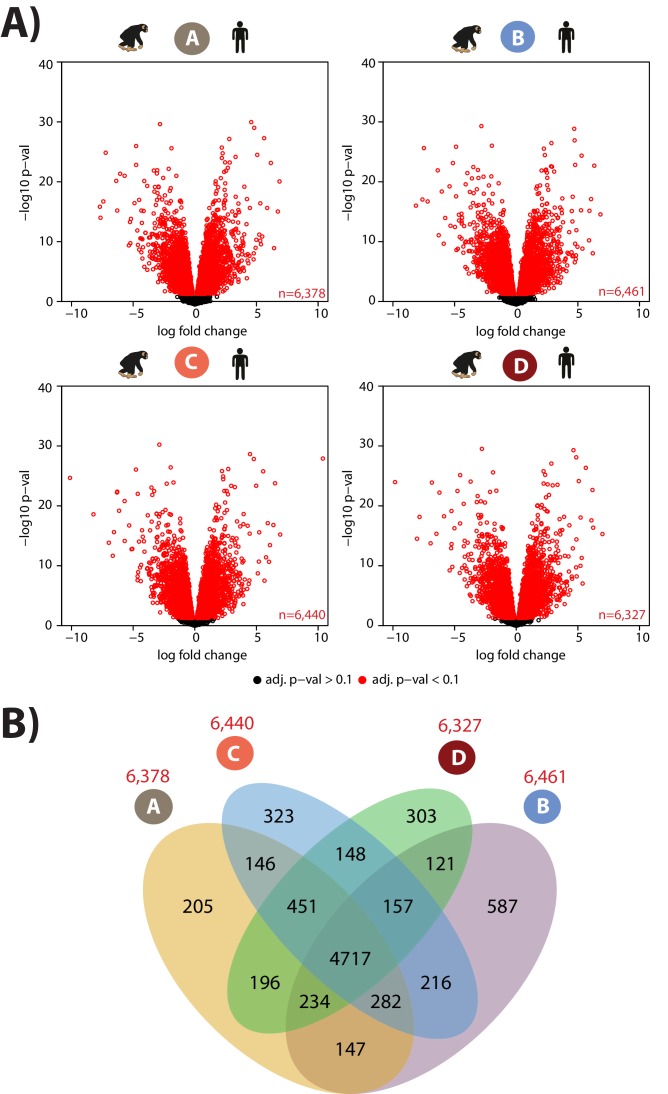
Figure 2—figure supplement 7. Thousands of genes are differentially expressed between species in each condition.

Figure 2—figure supplement 7.

(A) Genes that are significantly differentially expressed (adjusted p value of < 0.1) between species are shown in red. (B) Overlap of genes that are differentially expressed between species within a condition.