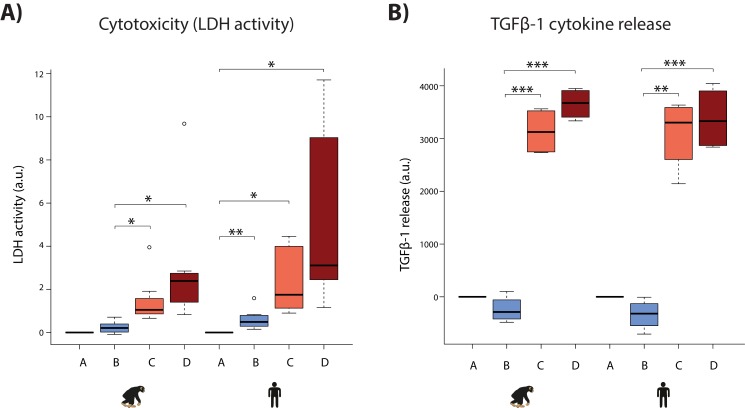
Figure 8. Hypoxia induces cytotoxicity and cytokine release in both species.
(A) Levels of LDH activity, a measure of cytotoxicity, in the cell culture media from each phase of the experiment in all samples from each species. (B) Levels of TGFβ−1, a pro-fibrotic cytokine, in the cell culture media from four representative individuals of each species. Values are normalized to normoxia or hypoxia values that is A (A-A), B (B-A), C (C-B), and D (D-B). Values from the baseline normoxic (A: brown), hypoxic (B: blue), short-term re-oxygenation (C: coral), and long-term re-oxygenation (D: dark red) conditions are shown in each species. Asterisk denotes a significant difference between conditions (*p<0.05, **p<0.005, ***p<0.0005).

