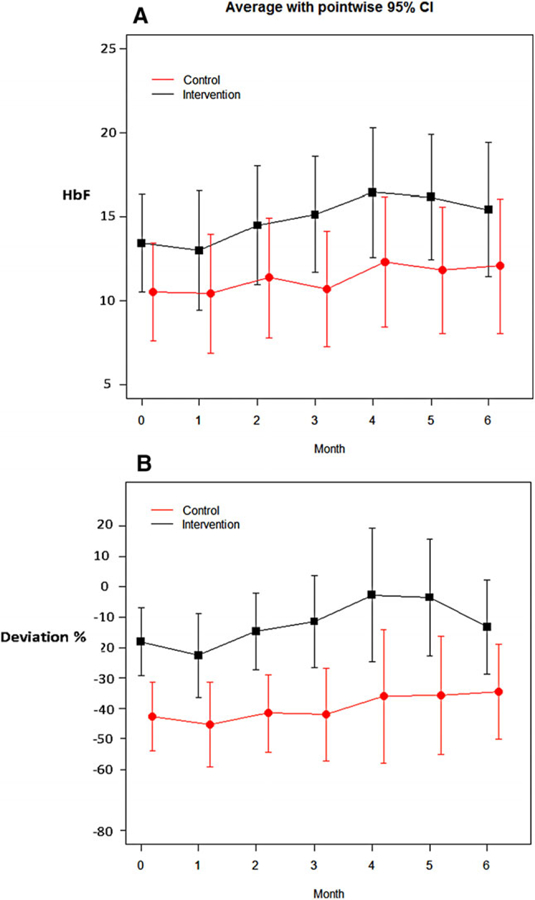
FIGURE 1.

Primary trial outcomes using HbF and decreased HbF from Personal best: Changes to fetal hemoglobin (HbF) by absolute number (A) or by decrease from Personal best (B) in the intervention and control groups (black and red lines, respectively). HbF and decrease from Personal best HbF improved for the intervention compared to the control group. Dashed line in lower panel marks Personal best (no deviation) (shown as mean values with pointwise 95% confidence interval, by group)
