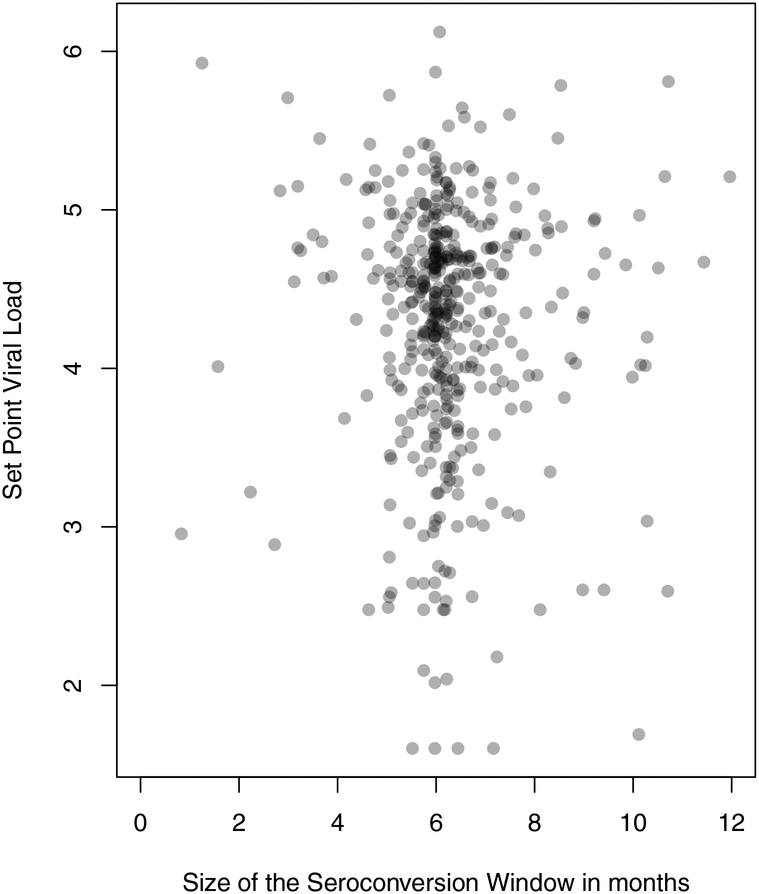
Fig. 1.
Seroconversion window and SPVL distributions, MACS sample.
Size of the seroconversion window reflects the duration in months between the last visit with HIV-1-negative test results and first visit with HIV-1-positive test results for men in our sample. SPVL is measured at the subsequent one or two visits, as described in the text.

