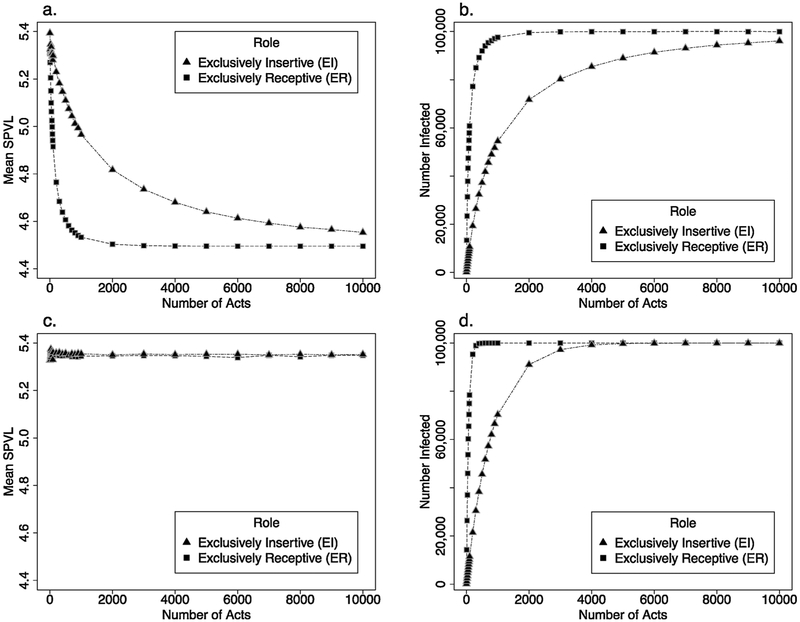
Fig. 2.
Results from one-generation model.
Mean SPVL and number of individuals infected changes based on role and number of sex acts in the one-generation model. In each panel, role signifies the role of the initially HIV-1-negative partner. In 2a and 2b, there was no partner change: individuals stayed in the same relationship for the duration of the modeled time. In 2c and 2d, individuals selected a new partner with every act. (a) Mean SPVL for each role group, without partner change; (b) Number of individuals infected for each role group, without partner change; (c) mean SPVL for each role group, with partner change; (d) number of individuals infected for each role group, with partner change.

