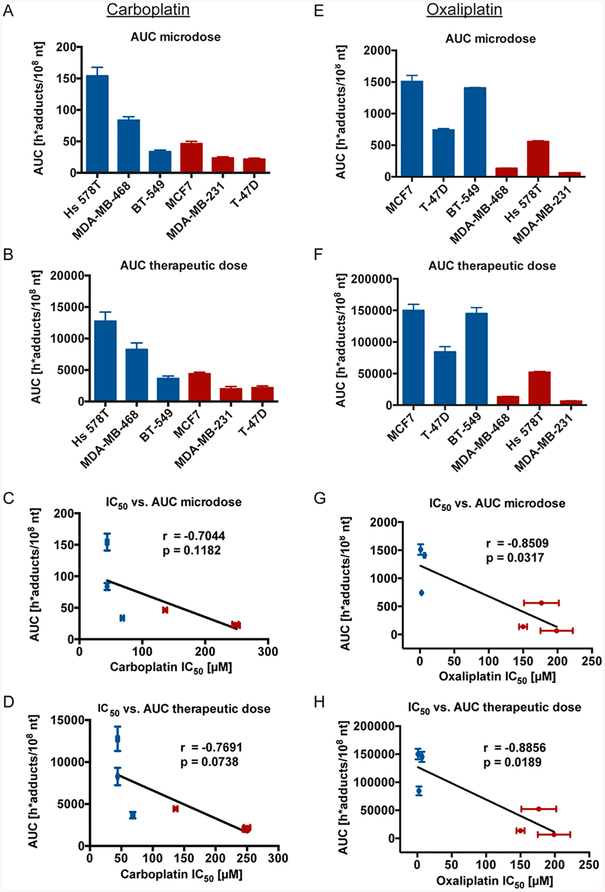
Figure 2.
Levels of carboplatin- and oxaliplatin-DNA adduct formation correspond to cellular platinum sensitivity. (A, B, E, F) The six breast cancer cell lines were treated as in Figure 1B, C, E, F and AUC levels determined in h*adducts/108 nt for each cell line. Each cell line was classified as sensitive (blue) or resistant (red) to carboplatin and oxaliplatin (Table 1). (C, D, G, H) Correlation analysis of microdose- or therapeutic dose-induced AUC compared to cellular IC50 in the six breast cancer cell lines. Error bars indicated the standard deviation from three biological replicates.

