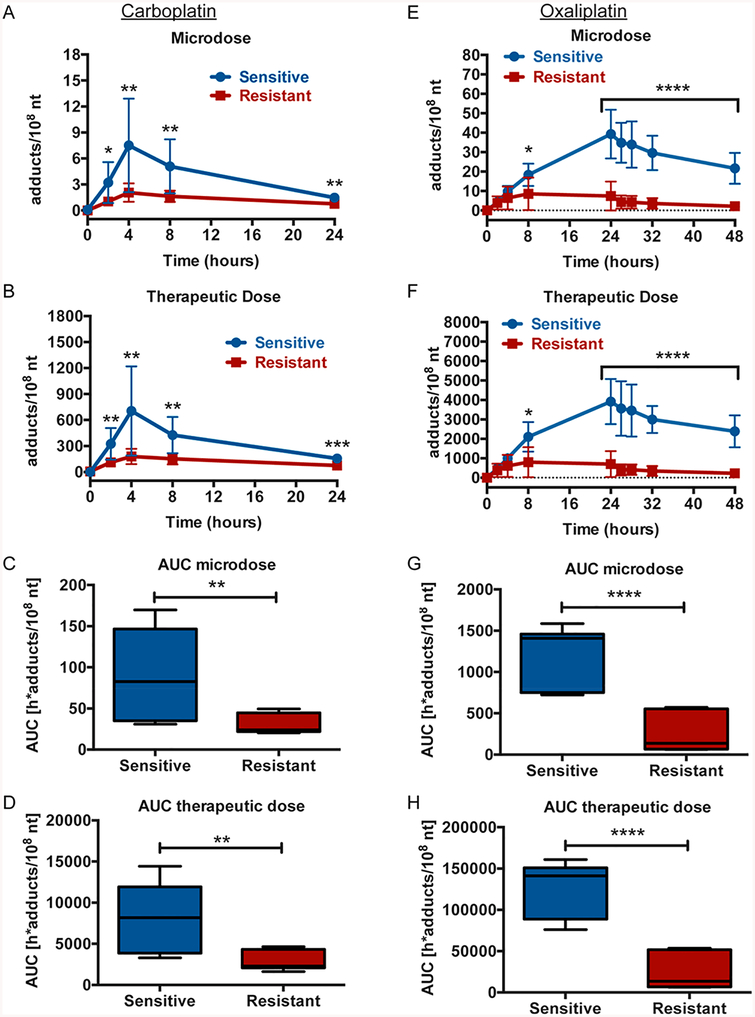
Figure 3.
Grouped sensitive breast cancer cell lines have significantly higher adduct levels than resistant cell lines. The six breast cancer cell lines were grouped as sensitive (blue) or resistant (red) to carboplatin and oxaliplatin as described in Table 1. (A, B, E, F) Sensitive and resistant groups of breast cancer cell lines were treated as in Figure 1B, C, E, F and adduct levels determined by AMS at indicated times after the start of treatment. t tests were used to determine statistical differences in adduct levels between the groups at each time point. (C, D, G, H) AUCs in h*adducts/108 nt were determined for the sensitive and resistant groups of breast cancer cell lines and displayed as box and whiskers plots with the black bar representing the median, the box representing the middle quartiles, and the whiskers representing the remaining data at indicated time points for each group. t tests were used to determine statistical differences in AUC between the groups. *p < 0.05, **p < 0.01, ***p < 0.001, ****p < 0.0001.

