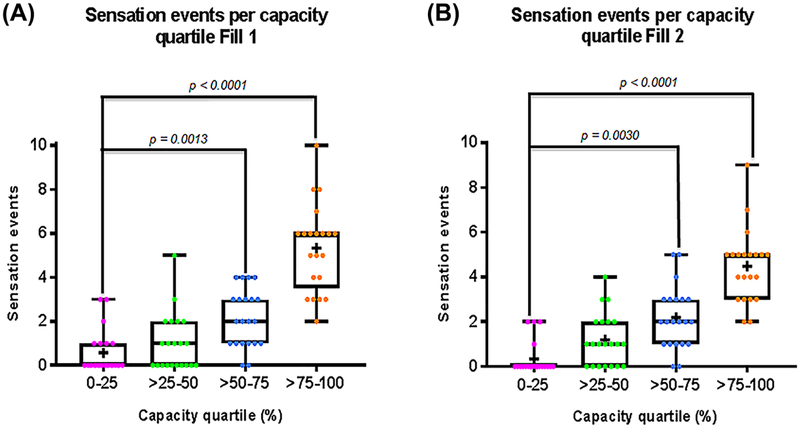
FIG. 3.
Changes in sensation events throughout the course of filling. Number of sensation events per capacity quartile (A, fill 1 and B, fill 2). Each dot represents one participant (total: n = 21). Capacity quartiles are marked pink (0–25), green (>25–50), blue (>50–75), and orange (>75–100). Both fills demonstrate a significant difference in the number of sensation events between the first and third (A, P = 0.013 and B,P = 0.003) and the first and final (A, P < 0.0001 and B, P < 0.0001) capacity quartiles

