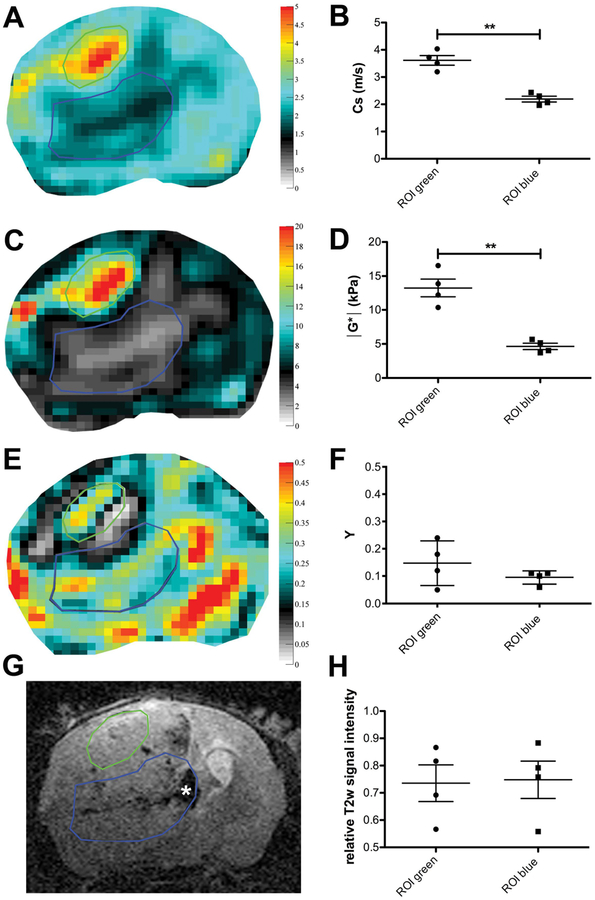
FIGURE 3.
Elastograms of shear wave speed (in m/s; A) and viscoelastic modulus (in kPa; C) show easily distinguishable sub-regions (encircled in green and blue) that are not as easy to distinguish on T2w RARE images (G) where the tumor appears relatively homogeneous, apart from intratumoral hemorrhages (asterisk in G). The elastogram of the phase angle Y (E) does not reveal a significant difference between the sub-regions either. The mean values of shear wave speed (B) and viscoelastic modulus (D) in the sub-regions were significantly different, whereas Y (F) and the mean relative T2w signal intensity (H) were similar in both regions. ** P < 0.01; ROIs covering tumor sub-regions in all mice compared in a paired t-test. Mean and SD are shown.

