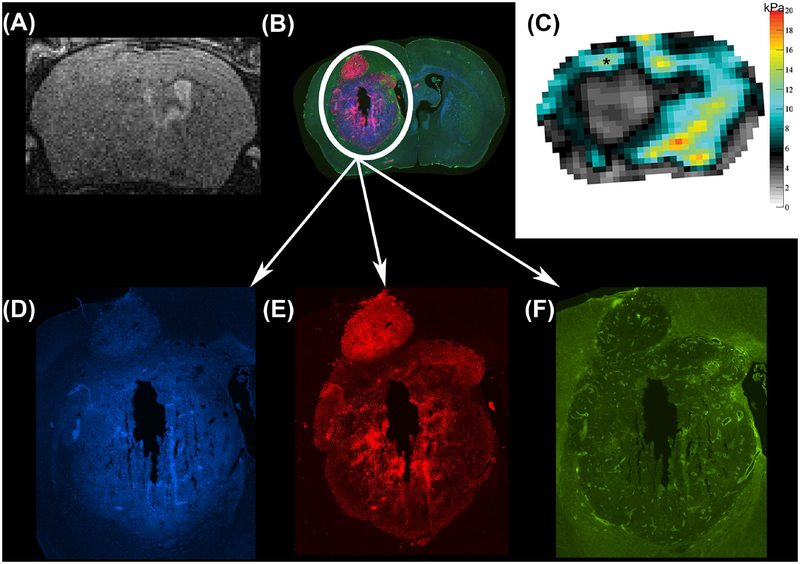
FIGURE 6.
Anatomical T2w RARE scan (A), immunofluorescent staining (B) and viscoelastic modulus map (in kPa; C), all in the same location in a mouse 4 weeks after tumor implantation. Magnifications of the tumor region show three different immunofluorescent channels depicting DNA in blue (Hoechst, D), viable tumor cells in red (endogenous mCherry red protein, E) and blood vessels in green (CD31, F). Of note, the stiffer tumor region (C, asterisk) presents with an intense red staining (B, E) indicating densely packed viable tumor cells.

