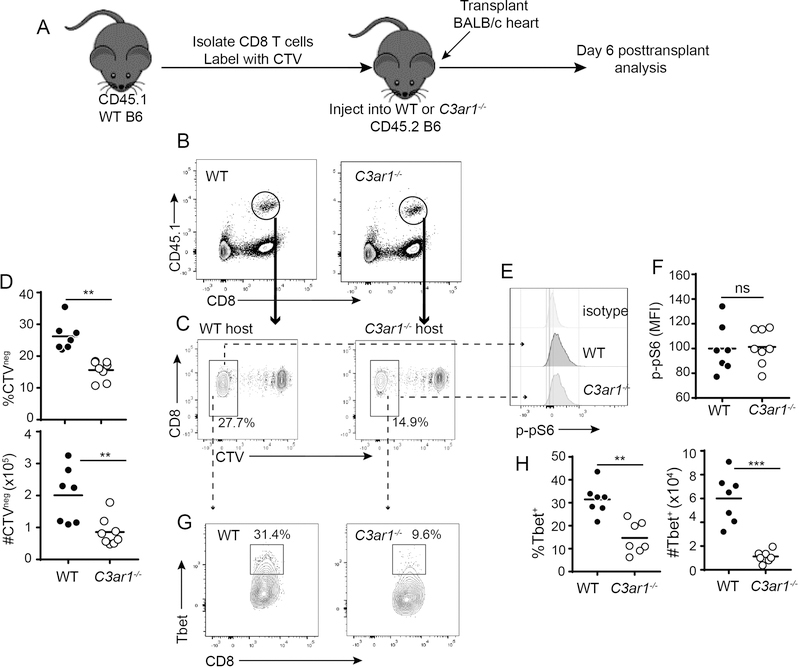
Figure 5. Absence of host C3aR1 limits CD8+ T cell limits alloreactivity in vivo.
A. Schematic outline of experiment design (see text). B. Representative flow cytometry plots of recipient spleen cells identifying the adoptively transferred CD45.1+ WT B6 CD8+ T cells (circle) in the congenic CD45.2+ WT or C3ar1−/− hosts 6 days post-transplant. C-D. Representative flow plots (C) and quantification of proliferating (CTV−) cells (D, top percentages, bottom numbers per spleen), gated on the transferred CD45.1+ CD8+ T cells. E-F. Representative histograms (E) and quantified MFI (F) of p-pS6 protein within the proliferating population of transferred cells; quantification of cumulative results were normalized to WT group average MFI (adjusted to a value of 100) in each individual experiment. G. Representative flow plots demonstrating T-bet expression within the proliferating CD45.1+ CD8+ T cells. Numbers within each plot are percentages within the outlined region. H-I. Quantified percentages (top) and absolute numbers (bottom) of T-bet+ cells within the CTV− CD45.1+ CD8+ T cell population. *p<0.05, **p<0.01, ***p<0.001, n=6–8/group.

