
Figure 1.
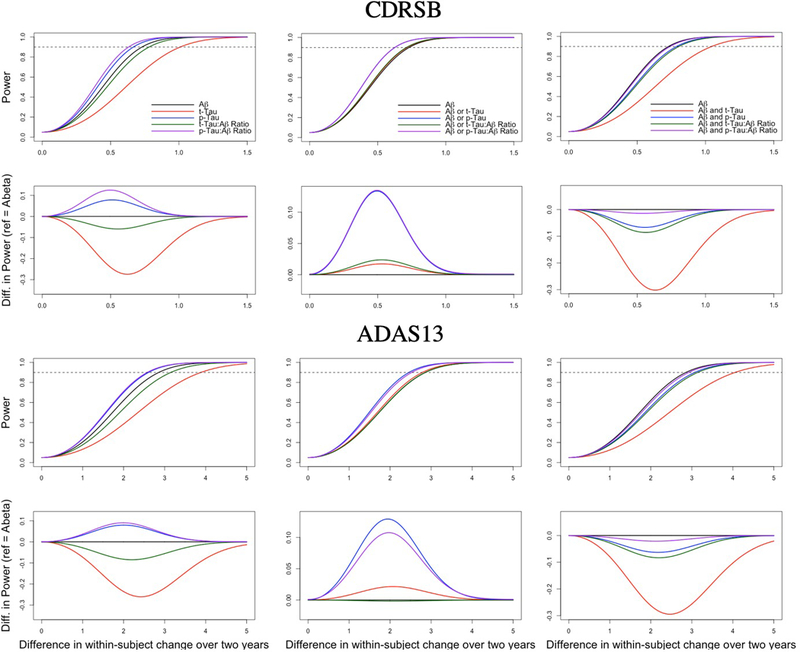
Power curves for trials incorporating the CDRSB (A-F) and ADAS13 (G-L) as primary outcomes. In the rows 1 (A-C) and 3 (G-I), power is plotted for trials using indicated biomarker inclusion criteria (and the associated sample sizes based on ADNI) for varying estimated treatment effects. The dotted horizontal line indicates 90% power. In rows 2 (D-F) and 4 (J-L), relative power is plotted, using trials enrolling based only on CSF Aβ as a reference.