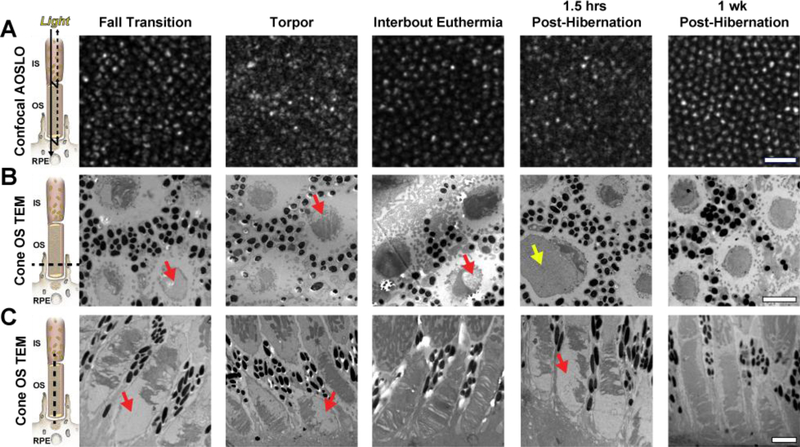
Figure 4 –
Intra-animal comparisons of confocal AOSLO (A), transverse/horizontal TEM outer segment (OS) sections (B), and longitudinal/vertical TEM OS sections (C) in different physiological states. Photoreceptor schematic in (A) is based off of a model presented by (Jonnal et al., 2007), in which the confocal signal is thought to arise from the waveguiding properties of the photoreceptor; whereas the schematics in (B) and (C) show the photoreceptor plane visualized with TEM (dashed line). Disruptions in OS structure (red arrows) and abnormally enlarged structures (yellow arrow) may disrupt the normal waveguide properties of photoreceptors and affect their confocal AOSLO signal. AOSLO scale bar = 20 μm. TEM scale bars = 2 μm.

