Figure 5 –
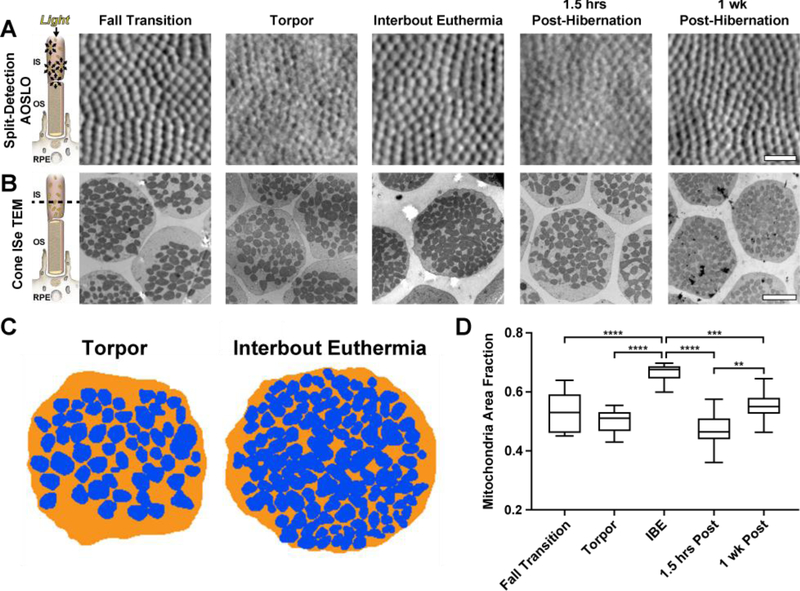
Intra-animal comparisons of split-detection AOSLO (A) and transverse TEM inner segment ellipsoid (ISe) sections (B). Photoreceptor schematic in (A) illustrates the hypothesized sources of split-detection AOSLO signal (Scoles et al., 2014), whereas the schematic in (B) shows the photoreceptor plane visualized with TEM (dashed line). Photoreceptor mitochondria were sparser in fall transition, torpor, and 1.5 hours post hibernation, compared to interbout euthermia (IBE) and 1-week post-hibernation. Residual photoreceptor structure was detected in all seasonal states via split-detection AOSLO (A). Mitochondrial packing within the ISe does not have a noticeable effect on the split-detection AOSLO image (A & B). Representative torpor and IBE mitochondrial volume segmentations (blue) within the ISe (orange) are shown in (C). Box-and-whisker plots of mitochondria area fraction (mitochondria area ÷ ISe area) in 5 distinct physiological states are shown in (D). Boxes show median and interquartile ranges, whiskers show maximum and minimum values. IBE mitochondrial area fraction was significantly increased compared to all other physiological states, suggesting increased mitochondria recruitment during these brief periods of euthermia (D). **P < 0.01; ***P < 0.001; ****P < 0.0001, one-way ANOVA. AOSLO scale bar = 20 μm. TEM scale bar = 2 μm.

