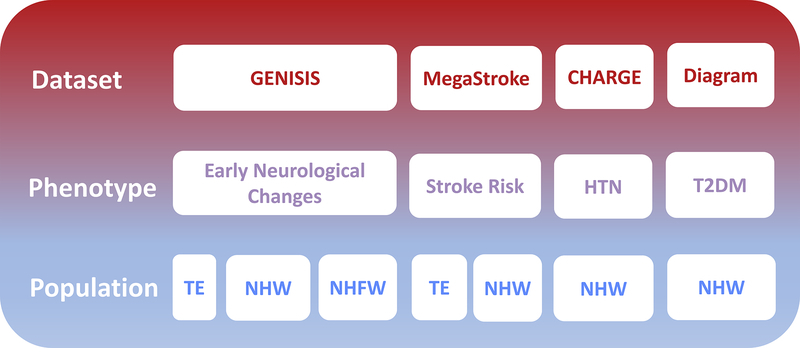
Figure 1. Study design scheme.
The study design scheme shows the different datasets with the phenotypes extracted from each of them (HTN – Hypertension, T2DM – Type 2 Diabetes Mellitus). The last row shows all the available populations depending on the study (TE – Trans-Ethnic, NHW – Non-Hispanic Whites and NHFW – Non-Hispanic, Non-Finnish Withes).

