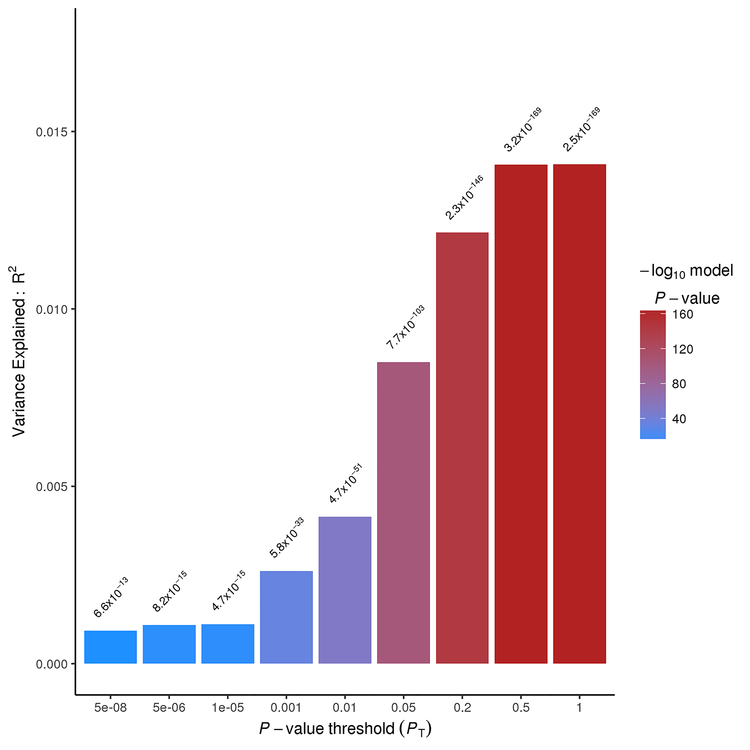
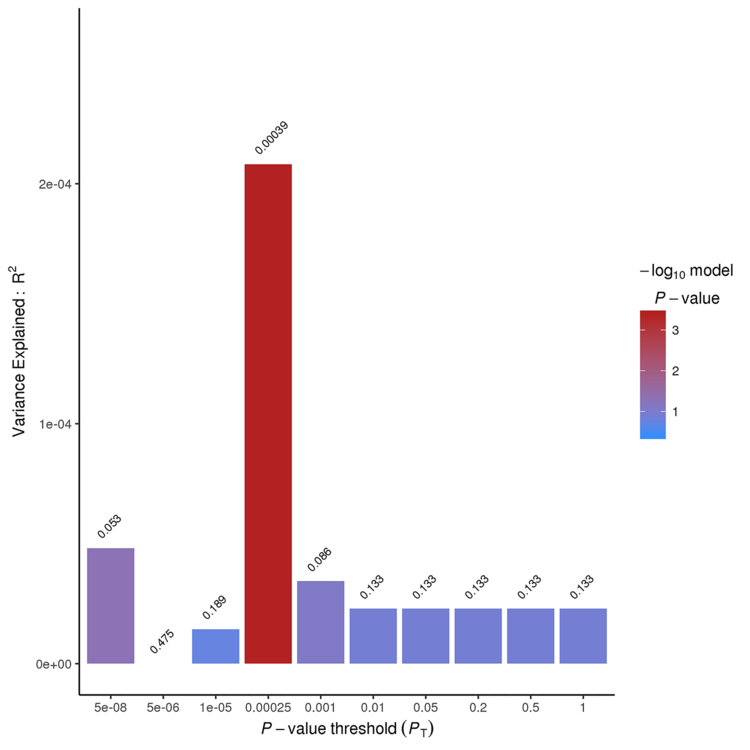
Figure 2. PRSice sumsum Bar Plots for the Type 2 Diabetes Mellitus (T2DM) and Hypertension (HTN) and risk of ischemic stroke, Nagelkerke’s fit.
A - Nagelkerke’s fit for the model: T2DM PRS ~ Ischemic Stroke Risk using the option sumsum from PRSice.
B - - Nagelkerke’s fit for the model: HTN PRS ~Ischemic Stroke Risk using the option sumsum from PRSice.


