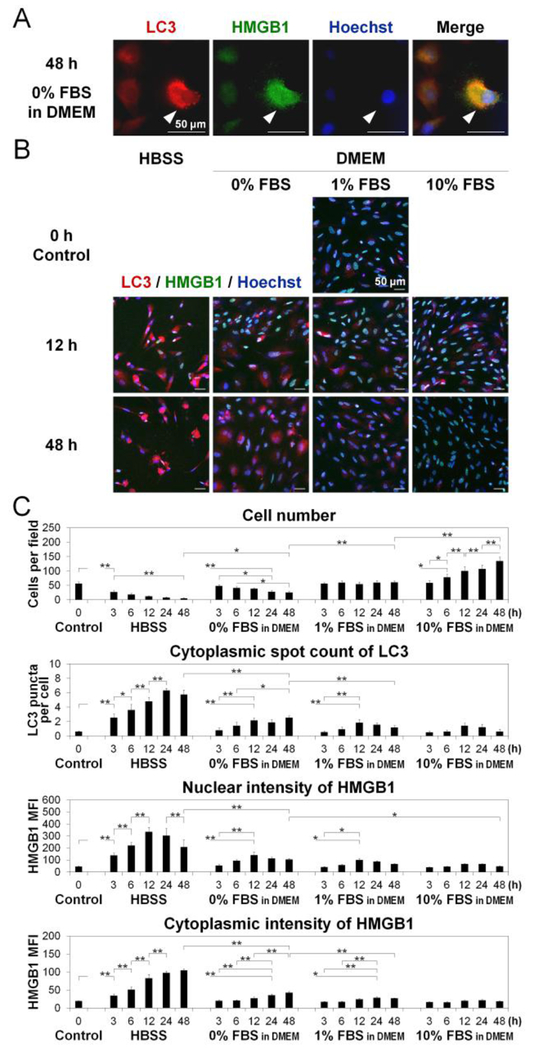
Fig. 3. Reduced serum and nutrients activate disc cellular autophagy.
(A) Imaging cytometry for light chain 3 (LC3) (red) and high mobility group box 1 (HMGB1) (green) in cells after 48-h culture in Dulbecco’s modified Eagle’s medium (DMEM) with 0% fetal bovine serum (FBS), showing autophagic cells (white arrows). Hoechst (blue) was used for counterstaining. Images shown are representative of four experiments with similar results (n = 4). (B) Time-course imaging cytometry for LC3 (red), HMGB1 (green), and Hoechst (blue) in cells after 0-, 3-, 6-, 12-, 24-, and 48-h culture in Hank’s balanced salt solution (HBSS) or DMEM with 0%. 1%. or 10% FBS. Images shown are representative of four experiments with similar results (n = 4). (C) Changes in cell number per field, cytoplasmic spot count of LC3 per cell, and mean fluorescent intensity (MFI) of HMGB1 in the nucleus and cytoplasm per cell in time-course analysis. Imaging cytometric data were automatically collected from up to 36 fields and analyzed according to an established algorithm as described in the methods. Data are mean ± SD (n = 4). Two-way analysis of variance with the Tukey-Kramer post-hoc test was used. *P < 0.05. **P < 0.01.

